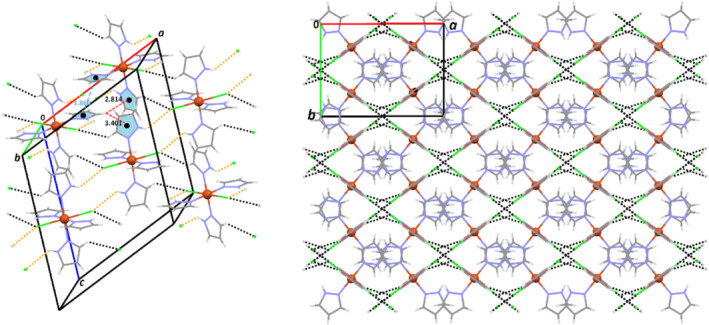
FIGURE 5.

Left: A selected molecule of 3 and its hydrogen bond interaction connectivities with neighboring molecules as dashed lines (black: C—H … Cl and orang: N—H … Cl, Table 2) has been shown. The C—H … π and π … π interactions (Table 2) between pyrazole rings are displayed as red and blue dash lines, respectively, in this view; Right: the 2 × 2 × 2 unit cell packing diagram of 3 viewed along the c axis has been presented showing the 3D network formed by the quoted intermolecular interactions (black dashed lines)
