
FIGURE 6.
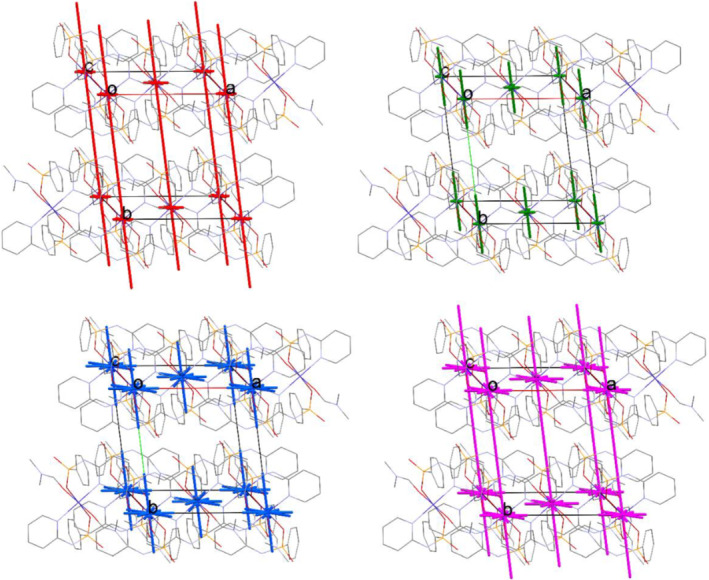
Energy‐vector diagrams representing the results of PIXEL calculations for 1 showing different components electrostatic (red wireframe), polarization (green), dispersion (blue), and total (purple)
Official websites use .gov
A
.gov website belongs to an official
government organization in the United States.
Secure .gov websites use HTTPS
A lock (
) or https:// means you've safely
connected to the .gov website. Share sensitive
information only on official, secure websites.
Energy‐vector diagrams representing the results of PIXEL calculations for 1 showing different components electrostatic (red wireframe), polarization (green), dispersion (blue), and total (purple)