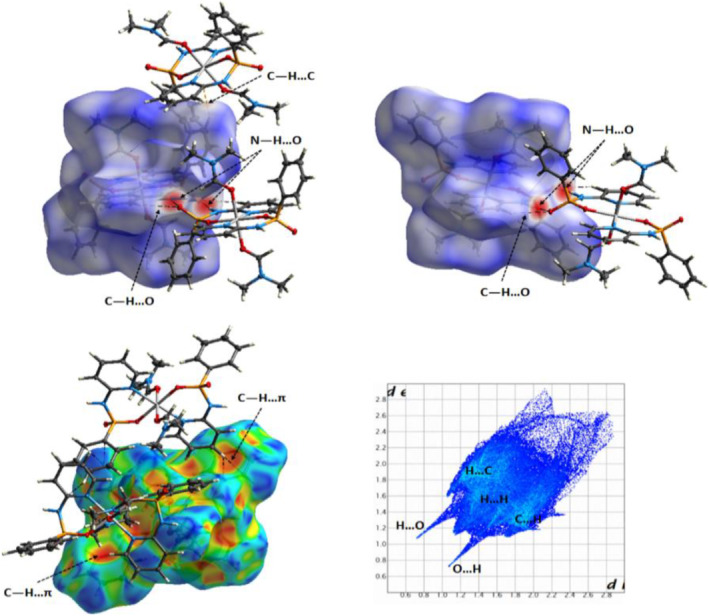
FIGURE 9.

HS mapped for the molecule Co1 of 1 with the d norm (up) and shape index (left down) properties showing main intermolecular contacts (N―H … O, C―H … O, C―H … C and C―H … π, Table 2) between the selected molecule inside the surface and its neighboring molecules. Full 2D fingerprint plot marking the main close contacts are represented on right down of figure. For decomposed FPs of various intermolecular contacts refer to supporting information
