Figure 2.

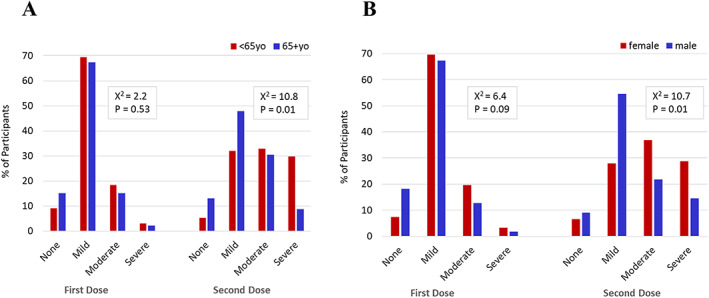
Symptom severity among participants by age and sex. Comparison of endorsed symptom severity following doses 1 and 2 of SARS–CoV‐2 vaccine by age groups (A) and by sex (B).

Symptom severity among participants by age and sex. Comparison of endorsed symptom severity following doses 1 and 2 of SARS–CoV‐2 vaccine by age groups (A) and by sex (B).