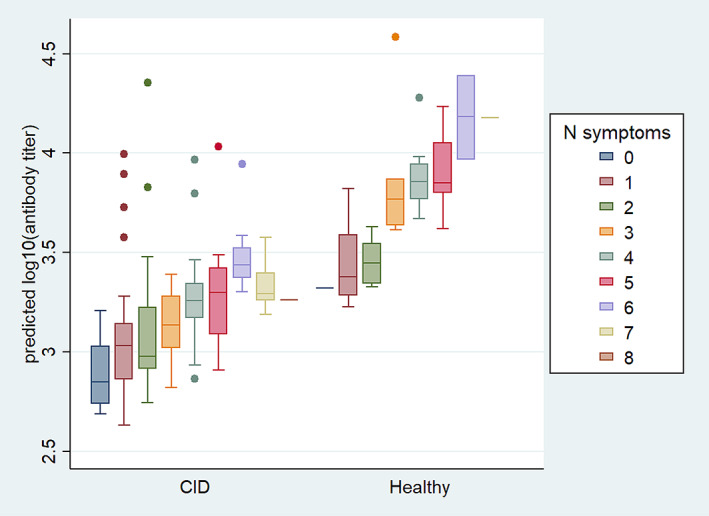
Figure 3.

Predicted antibody titers following second dose by number of symptoms in patients with chronic inflammatory disease (CID) and healthy control subjects. The regression model depicts change in anti–SARS–CoV‐2 spike IgG ± antibody titer with each increase of 1 endorsed symptom following second dose of vaccine in CID patients and healthy controls.
