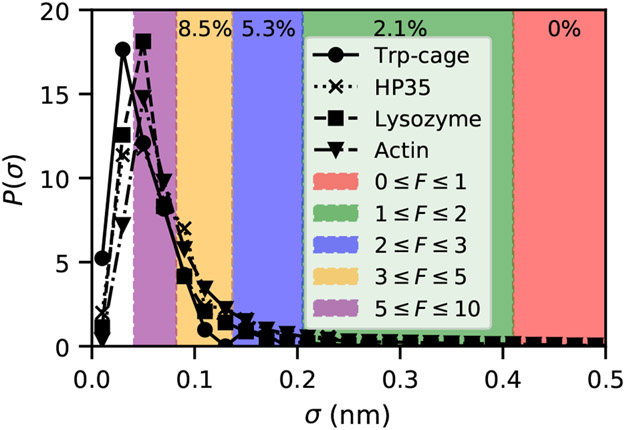
Figure 2:
Distribution of standard deviations of inter-residue distances over 50 ns of MD for four different protein systems. Actin data is from Ref. 5 and simulation details for other systems are described in the SI. Colored regions show for which forces linear-response along a particular residue-residue distance would be violated, according to Eq. 5. Percentages at the top reflect the fraction of distances in HP35 where linear response would be violated by a force in the colored regime.

