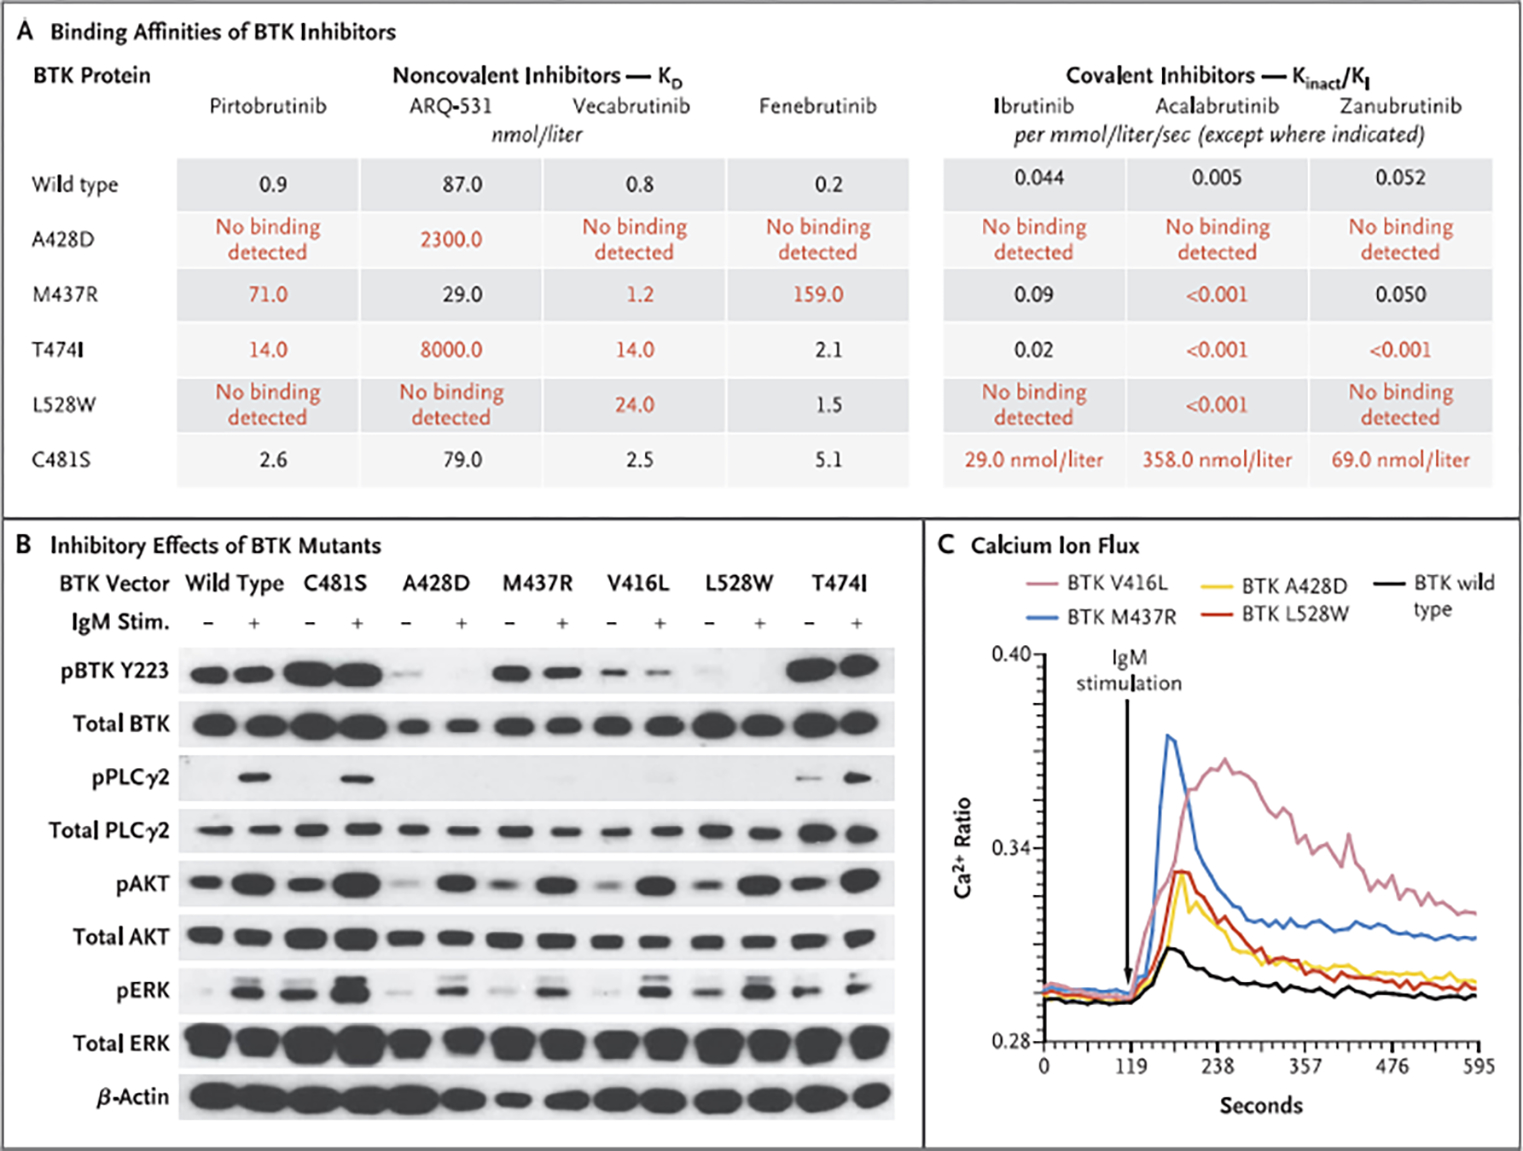
Figure 3. Effect of BTK Resistance Mutations on Binding of Noncovalent and Covalent Inhibitors to BTK and on B-Cell–Receptor Signaling.

Panel A shows the binding affinities (KD) of each noncovalent BTK inhibitor to purified wild-type or mutant BTK protein, determined with the use of surface plasmon resonance technology. On the right are Kinact/K| values for covalent BTK inhibitors on the enzymatic activity of each wild-type or mutant BTK protein. The Kinact/K| value indicates the efficiency of covalent bond formation between each drug and BTK protein. Red values indicate mutants that decreased drug-binding efficiency by a factor of at least 10. The KD values for the covalent inhibitors to BTK C481S are reported. Panel B shows the inhibitory effects of TMD8 cells transduced with BTK mutants (C481S, A42ED, M437R, V416L, L528W, and T474I) on BTK autophosphorylation at Y223 and PLCγ2 phosphorylation at Y1217, On IgM stimulation of TMD8 cells, BTK mutants activated AKT (phosphorylated S473) and extracellular signal-related kinase (ERK; phosphorylated Y202 and Y204) signaling pathways similarly to wild-type BTK. (The prefix “p” indicates phosphorylation.) However, as shown in Panel C, intracellular calcium was elevated to higher levels in cells expressing BTK mutants than in those expressing wild-type BTK. The Ca2+ ratio is based on flow cytometry performed with lndo-1 (Life Technologies); higher values indicate greater concentrations of intracellular calcium.
