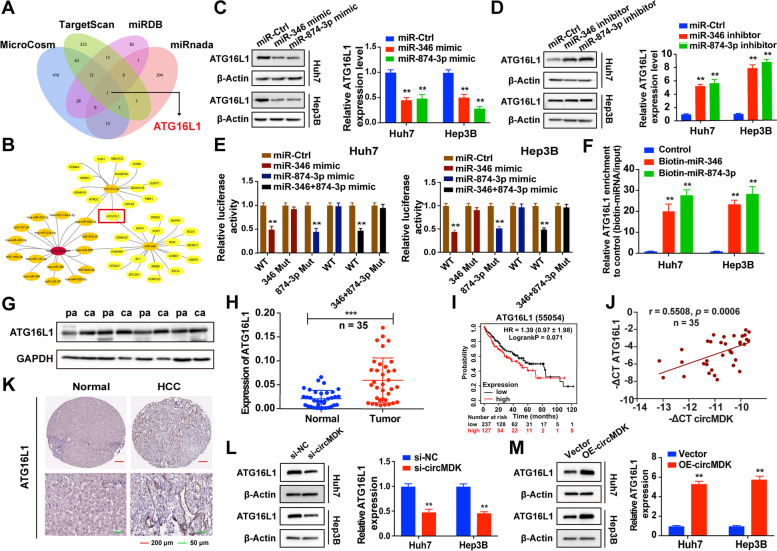
Fig. 5.
CircMDK functions as a decoy of miR-346 and miR-874-3p to increase ATG16L1 expression. A ceRNA analysis for circMDK by Cytoscape. B Schematic illustration of overlapping target mRNAs of miR-346 and miR-874-3p predicted by MicroCosm, TargetScan, miRDB and miRanda databases. C Relative protein (left) and mRNA (right) levels of ATG16L1 in HCC cells transfected with miR-Ctrl, miR-346 mimic, and miR-874-3p mimic. **p < 0.01. D Relative protein (left) and mRNA (right) levels of ATG16L1 in HCC cells transfected with miR-Ctrl, miR-346 inhibitor, and miR-874-3p inhibitor. **p < 0.01. E Luciferase assay in HCC cells co-transfected WT or mutant (346 Mut/874-3p Mut) ATG16L1 plasmid together with miR-346 and miR-874-3p mimic or miR-Ctrl. **p < 0.01. F Enrichment of ATG16L1 pulled down by biotin-labeled miR-346 and miR-874-3p, or negative control. **p < 0.01. G Relative protein levels of ATG16L1 in four paired HCC samples. pa: para-carcinoma tissues; ca: cancer tissues. H Relative mRNA levels of ATG16L1 in 35 paired HCC samples. mRNA and protein levels of ATG16L1 in four paired HCC samples. ***p < 0.001. I Kaplan–Meier analysis revealed the prognostic values of ATG16L1. J Correlation analysis revealed positive correlation between the levels of circMDK and ATG16L1 mRNA in the tumorous tissues of the 35 HCC patients. K The expression of ATG16L1 in human HCC tissue compared to normal liver tissue. L Relative protein (left) and mRNA (right) levels of ATG16L1 in HCC cells transfected with si-circMDK or si-NC. **p < 0.01. M Relative protein (left) and mRNA (right) levels of ATG16L1 in HCC cells transfected with circMDK overexpression or its empty vector. **p < 0.01. Data are shown as mean ± SD of three independent experiments

