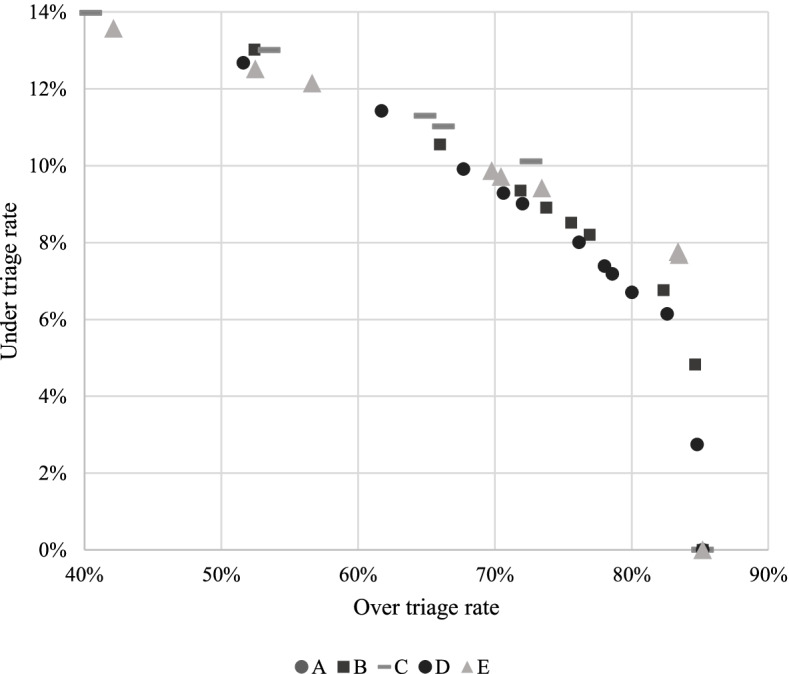
Fig. 2.

Over/under triage rates of various decision trees. + Each marker represents a different CHAID decision tree, as listed in Table 4. *Model A variables were: MPDS dispatch codes. Model B variables were: MPDS dispatch codes, anyone trapped, vulnerable road user, airbag deployed, atmosphere, road surface. Model C variables were anyone trapped, vulnerable road user, anyone not ambulant, atmosphere, accident type. Model D variables were: MPDS dispatch codes, anyone trapped, vulnerable road user, anyone aged ≥ 75 years, day of the week, single v. multi-vehicle, airbag deployed, atmosphere, road surface, lighting, accident type. Model E variables were: MPDS dispatch codes, anyone trapped, vulnerable road user, anyone aged ≥ 75 years, day of the week, single v. multi-vehicle, airbag deployed, atmosphere, road surface, lighting, accident type
