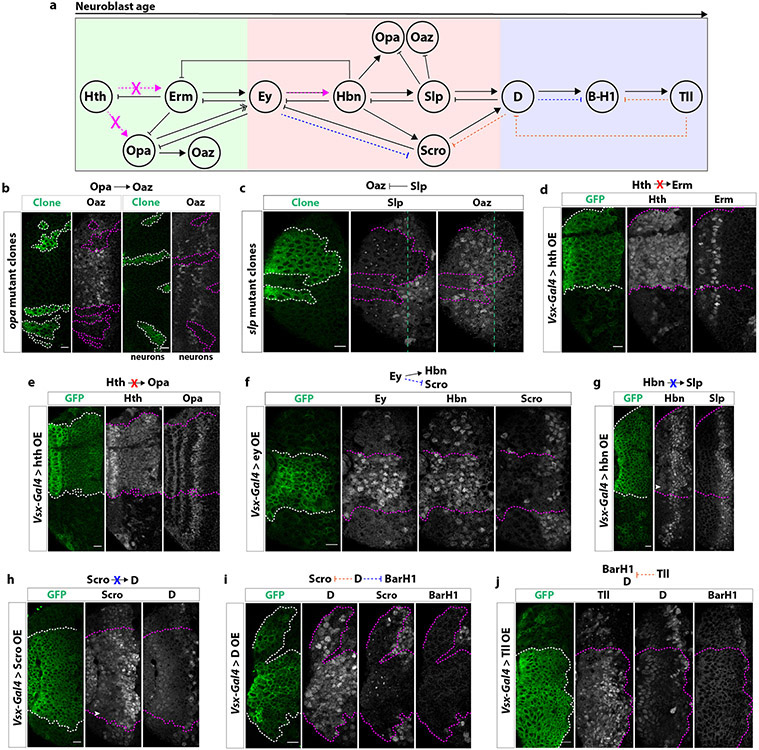
Extended Data figure 6: Additional genetic interactions between tTFs.
(a) Diagram of genetic interactions between tTFs in medulla neuroblasts. Magenta dashed arrows within the diagram indicate genetic interactions determined with misexpression of tTFs that confirm previous results from MARCM and knock-down experiments. Orange dashed arrows indicate genetic interactions uncovered with misexpression experiments. Blue dashed arrows indicate genetic interactions determined with misexpression experiments that are opposite to previous MARCM or knock-down experiments.
(b) Left: In opa mutant clones (GFP: green), Oaz is not expressed, suggesting that Opa is necessary for the activation of Oaz. Right: Accordingly, oaz neurons are lost in opa mutant clones.
(c) Slp inhibits the expression of Oaz. In slp mutant clones (GFP: green), Oaz remains expressed in older neuroblasts.
(d) In cells misexpressing Hth driven by Vsx-Gal4 (GFP: green), Erm expression is not affected, indicating that Hth does not activate Erm.
(e) In cells misexpressing Hth driven by Vsx-Gal4 (GFP: green), Opa expression is not affected, indicating that Hth does not activate Opa.
(f) In cells misexpressing Ey driven by Vsx-Gal4 (GFP: green), Hbn expression is activated and Scro expression repressed.
(g) In cells misexpressing Hbn driven by Vsx-Gal4 (GFP: green), Slp expression is not activated earlier. White arrowhead indicates low levels of Hbn protein being misexpressed early compared to adjacent wildtype tissue.
(h) In cells misexpressing Scro driven by Vsx-Gal4 (GFP: green), D expression is not activated earlier. White arrowhead indicates low levels of Scro protein being misexpressed early compared to adjacent wildtype tissue.
(i) In cells misexpressing D driven by Vsx-Gal4 (GFP: green), both Scro and BarH1 expression are repressed.
(j) In cells misexpressing Tll driven by Vsx-Gal4 (GFP: green), both D and BarH1 expression are repressed.
Scale bars: 10 μm

