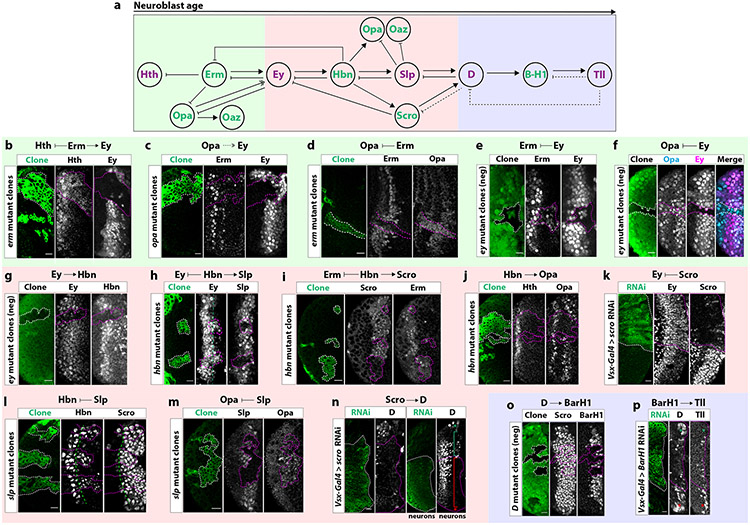
Figure 2. Complex genetic interactions between tTFs control the progression of the temporal series.
(a) The temporal series is subdivided into three units (early: green, middle: red and late: blue) by previously identified (purple) and new (green) tTFs.
(b) In erm MARCM mutant clones (GFP: green), Hth is extended and Ey is lost.
(c) In opa MARCM mutant clones (GFP: green), Erm is unaffected and Ey expression is delayed.
(d) In erm MARCM mutant clones (GFP: green), Opa is extended.
(e) Negatively labeled ey MARCM mutant clones (GFP-negative) express Erm beyond its temporal window.
(f) ey MARCM mutant clones (GFP-negative) express Opa beyond its temporal window. (g) In ey MARCM mutant clones (GFP-negative), Hbn expression is lost.
(h) In hbn MARCM mutant clones (GFP: green), Ey expression is extended, while Slp expression is lost.
(i) In hbn MARCM mutant clones (GFP: green), Erm is expanded and Scro expression is lost.
(j) The second Opa expression window is lost in hbn mutant clones (GFP: green).
(k) Cells expressing scro RNAi (GFP+: green; scro−) continue to express Ey into later temporal windows.
(l) In slp MARCM mutant clones (GFP: green) Hbn expression is extended without affecting Scro,.
(m) In slp MARCM mutant clones (GFP: green), Opa extends to later temporal windows.
(n) Left: In neuroblasts expressing scro RNAi (GFP+: green), D expression is lost. Right: Neurons coming from the D temporal window express D (green bracket). In the absence of Scro, D is no longer expressed (red bracket). Wild-type (green asterisk) and scro-RNAi expressing neuroblasts (D-, red asterisk) can be found in the surface.
(o) In negatively marked D mutant clones (GFP-negative), BarH1 expression is lost and Scro expression is unaffected.
(p) In comparison to wild-type NBs (red asterisk), NBs expressing BarH1 RNAi (GFP: green) (green asterisk) do not express Tll.
Genetic interactions uncovered in each experiment are shown for each panel. Scale bars: 10 μm

