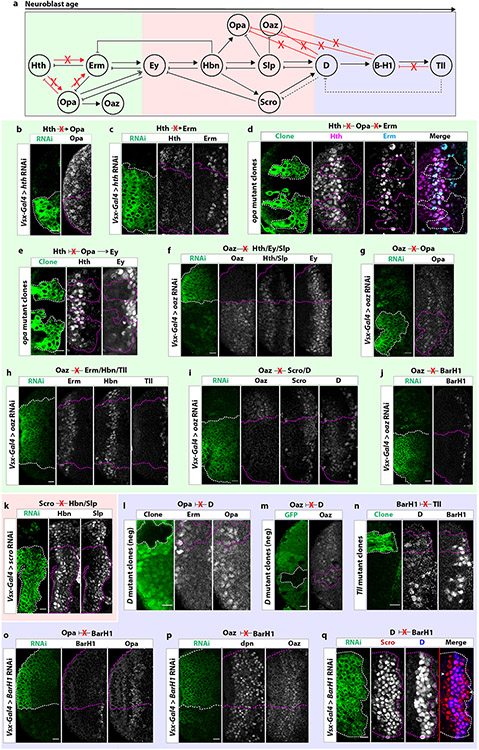
Extended Data figure 5: Negative genetic interactions between tTFs.
(a) Diagram of genetic interactions between tTFs in medulla neuroblasts. Red “X”‘s within the diagram indicate no genetic interaction. Within the early unit (green box), we identified three new tTFs: Opa, Erm and Oaz. Hth does not activate Erm or Opa. Furthermore, Opa does not repress Hth or activate Erm. Within the middle unit (red box), we identified three new temporal factors: Homeobrain (Hbn), Scarecrow (Scro) and Opa. Opa is not inhibited by D or BarH1. Oaz is also not inhibited by D or BarH1. Within the late unit (blue box) we identified one new temporal factor: BarH1. Tailless (Tll) is not necessary to inhibit BarH1.
(b) In cells expressing hth RNAi driven by Vsx-Gal4 (GFP: green), Opa expression is not affected, indicating that Hth does not activate Opa.
(c) Erm is unaffected in cells expressing hth RNAi driven by Vsx-Gal4 (GFP: green). Hence, Hth does not activate Erm.
(d) In opa mutant clones (GFP: green), Hth and Erm expression are unaffected, indicating that Opa does not inhibit Hth and does not activate Erm.
(e) In opa mutant clones (GFP: green), Ey expression is delayed, indicating that Opa helps to time the expression of Ey.
(f-j) In cells expressing Oaz RNAi driven by Vsx-Gal4 (GFP: green), (f) Hth, Ey, Slp, (g) Opa, (h) Erm, Hbn, Tll, (i) Scro, D, and (j) BarH1 are unaffected, indicating that Oaz does not regulate their expression.
(k) Scro knock-down upon expression of scro RNAi (GFP: green) does not affect the expression of Hbn or Slp, as was expected given that Scro is coexpressed with both (see Figure 2).
(l) In negatively marked D mutant clones, the expression of Opa is unaffected, indicating that D does not inhibit Opa.
(m) Similarly, in negatively marked D mutant clones, the expression of Oaz is unaffected, indicating that D does not inhibit of Oaz.
(n) In Tll mutant clones (GFP: green), neither D nor BarH1 expression are affected, indicating that Tll is not necessary to inhibit either factor.
(o-q) In cells expressing RNAi against BarH1, (o) Opa, (p) Oaz, and (q) D are unaffected, indicating that BarH1 does not regulate their expression.
Scale bars: 10 μm

