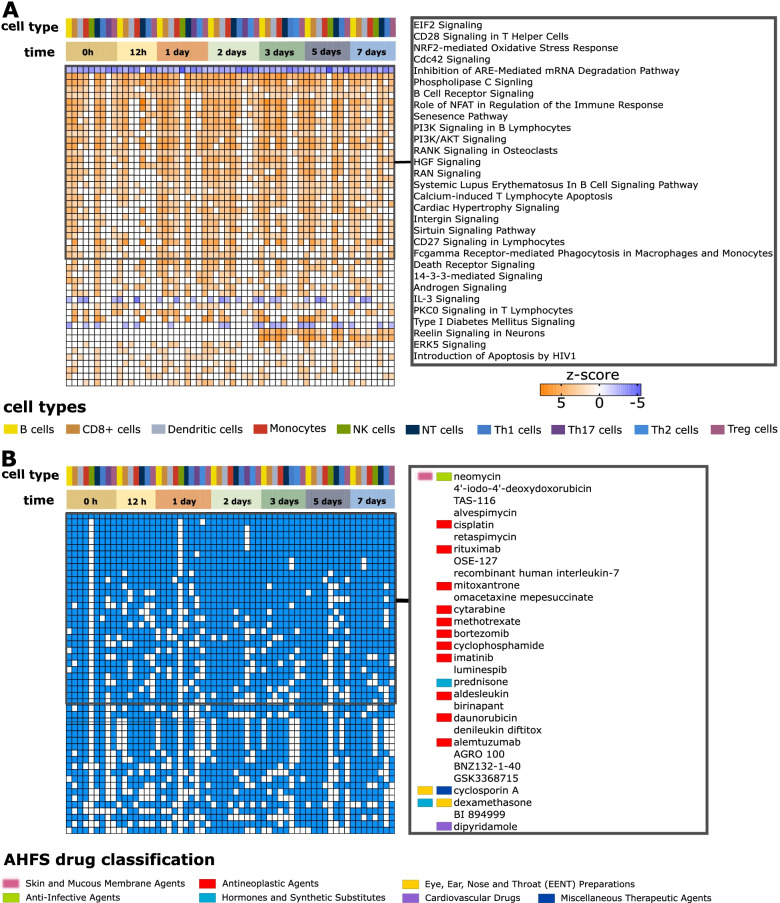
Fig. 4.
Ranking of pathways and therapeutic targets. A Heatmap of top 50 pathways ranked based on their enrichment in different cell types at different time points (|z-score|≥ 2 and P-value < 0.05). The color intensity of orange and blue boxes indicates significance of enrichment. Gray boxes indicate non-significant predictions. An orange box indicates directions of the differential expression that match the predicted direction, while a blue box indicates the opposite (z-score ≥2 or ≤−2, respectively). B Heatmap representing top 50 drugs predicted to target most of the cell types at most time points. A blue square means that the drug was predicted to target a cell type at the time point, and a white square denotes that the drug was not predicted to target a cell type at the time point. Drug names identified with IPA were matched with DrugBank drug names. For matching drugs American Hospital Formulary Service (AHFS) classification numbers were retrieved, and the overriding categories listed at RxID [50] are reported in the figure. The inserted boxes on the right correspond to the top 30 pathways (A) and drugs (B) in the left boxes

