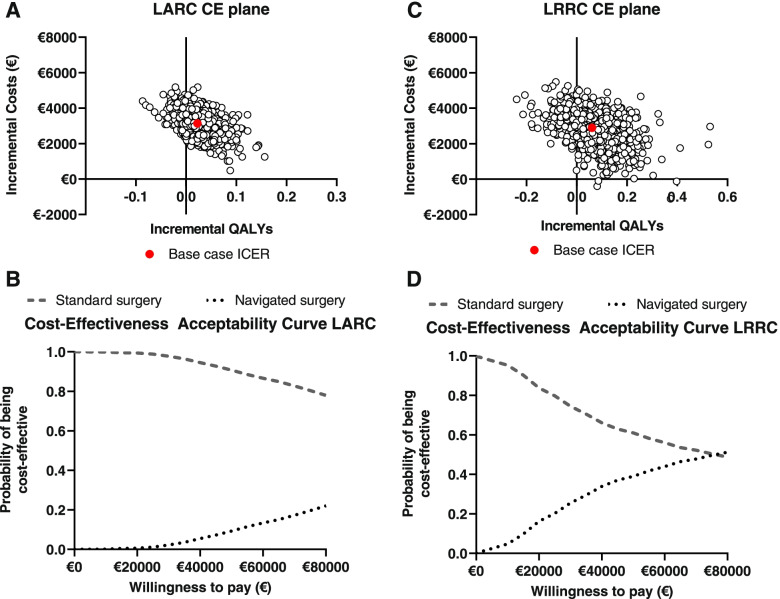
Fig. 3.
A and C show Cost-effectiveness planes for LARC (A) and LRRC (C) showing the incremental Quality Adjusted Life Years (QALYs) per incremental costs for navigated surgery versus standard surgery. The scatterplots show the mean differences in costs and outcomes from the data using 2000 bootstrap replicates. In both indications, most of the observations are in the North-East quadrant which indicates improved outcomes at higher costs. B and D show Cost-Effectiveness Acceptability Curves for LARC (B) and LRRC (D) presenting the probability of the cost-effectiveness of navigated surgery and standard surgery for a range of willingness to pay thresholds

