Figure 1.
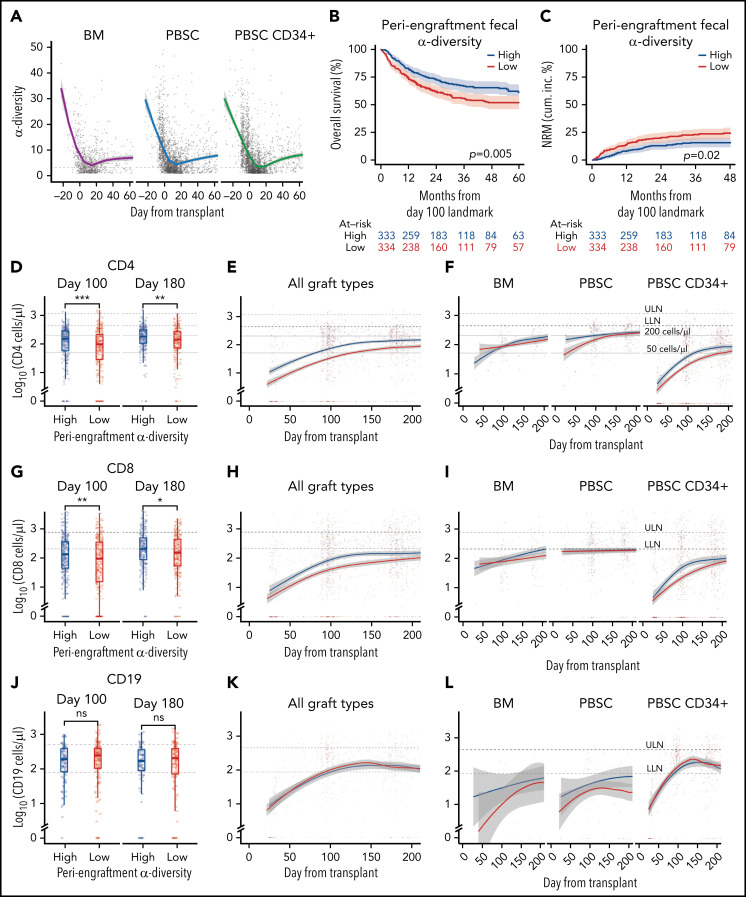
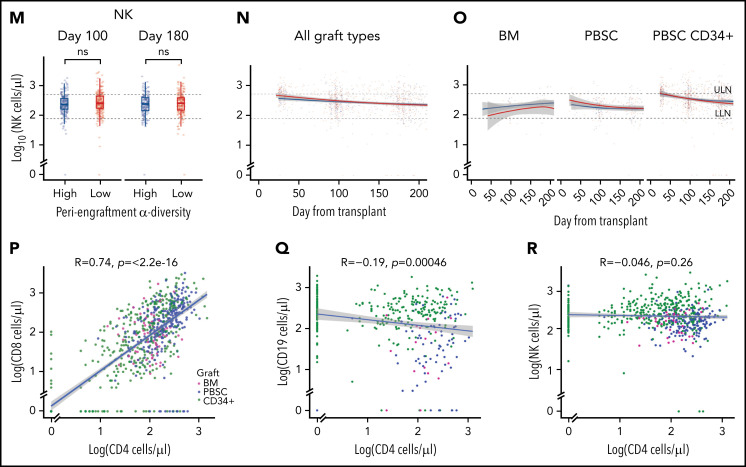
Intestinal microbial α-diversity is associated with immune reconstitution patterns after allo-HCT. (A) Stool α-diversity over time (n = 868; BM, 85; PBSCs, 347; CD34+ PBSCs, 436). The median periengraftment (days 7-21 after HCT) α-diversity is shown with the dotted horizontal line at 3.28. OS (B) and NRM (C) cumulative incidence in patients with high and low periengraftment α-diversity. (D) CD4 counts at days 100 and 180 post-HCT in patients with above- and below-median periengraftment α-diversity (n = 633 patients; BM, 71; PBSCs, 245; CD34+ PBSCs, 317). CD4 counts over time in all graft recipients (E) and separated by graft type (F) (n = 645 patients; BM, 73; PBSCs, 250; CD34+ PBSCs, 322). (G-I) CD8 T-cell counts. (D-F) The lower limit of normal (LLN) = 429 cells per microliter, and the upper limit of normal (ULN) = 1331 cells per microliter. (G) CD8 T-cell counts at days 100 and 180 post-HCT in patients with low and high periengraftment α-diversity (n = 633 patients; BM, 71; PBSCs, 245; CD34+ PBSCs, 317). CD8 counts over time in all graft recipients (H) and separated by graft type (I) (n = 645 patients; BM, 73; PBSCs, 250; CD34+ PBSCs, 322). (G-I) LLN = 209 cells per microliter and ULN = 768 cells per microliter. (J) CD19 counts at days 100 and 180 post-HCT in patients with low and high periengraftment α-diversity (n = 272; BM, 19; PBSCs, 67; CD34+ PBSCs, 186). CD19 counts over time in all graft recipients (H) and separated by graft type (I) (n = 314 patients; BM, 23; PBSCs, 85; CD34+ PBSCs, 206). (J-L) LLN = 78 cells per microliter and ULN = 510 cells per microliter. (M) NK counts at days 100 and 180 post-HCT in patients with low and high periengraftment α-diversity (n = 479; BM, 43; PBSCs, 165; CD34+ PBSCs,: 271). NK counts over time in all graft recipients (N) and separated by graft type (O) (n = 492; BM, 45; PBSCs, 171; CD34+ PBSCs, 276). (M-O) LLN = 78 and ULN = 510 cells per microliter. (P-R) Correlations of CD4 count with CD8 T-cell count (P), CD19+ B-cell count (Q), and NK-cell count (R). R represents the Pearson correlation coefficient. Statistical comparison for (D,G,J,M) was performed with the Wilcoxon rank-sum test.


