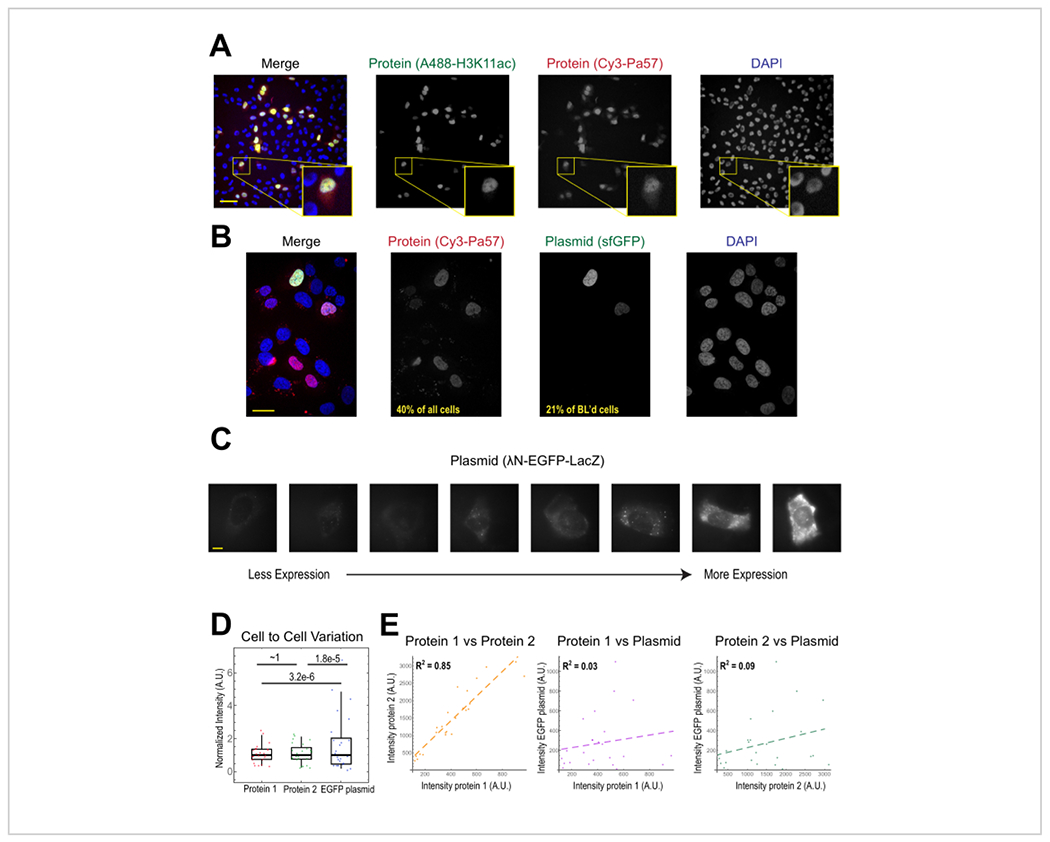
Figure 2. Bead loading introduces low variability in protein concentration but high variability in plasmid expression.

(A) Cells were bead-loaded with 0.5 μg of each of Alexa488-conjugated anti-H3K27 acetyl Fab (green) and Cy3-conjugated anti-RNAPII-Serine 5-phosphorylated Fab (red) in 4 μL of bead loading solution. Cells were DAPI-stained (blue) and then live-imaged immediately. Scale bars = 20 μm. (B) Cells were bead-loaded with 0.5 μg of Fab protein (Cy3-conjugated anti-RNAPII-Serine 5-phosphorylated protein, red) and 1 μg of plasmid encoding superfolder GFP-H2B (green) in 4 μL of bead loading solution. After 24 h, cells were DAPI-stained (blue) and imaged live. Scale bars = 30 μm. (C-E) Protein 1 (JF646-HaloLigand-labeled HaloTag-MCP), protein 2 (Cy3-conjugated anti-FLAG Fab), and a plasmid encoding EGFP (λN-EGFP-LacZ) were bead-loaded together into cells. The total intensity in each fluorescent channel was measured in a 1.3 x 1.3 μm patch in the cytoplasm of each cell. N = 25 cells. (C) Representative cells expressing the bead-loaded plasmid, λN-EGFP-LacZ. The same imaging conditions and intensities were used for all cells. Spots are aggregates of the expressed protein. Scale bars = 10 μm. (D) The chart shows each cell’s total intensity of either protein 1, protein 2, or EGFP expressed from the plasmid. Each channel was normalized to the median. Bonferroni-corrected P values were calculated by the Fisher Ratio test to determine whether the distribution of protein or plasmid intensity data has the same variability. Each point represents a cell. (E) The total intensities for either both proteins, protein 1 and the plasmid, or protein 2 and the plasmid, are plotted against each other. Calculated R2 values are displayed. Each point represents a cell. Abbreviations: DAPI = 4′,6-diamidino-2-phenylindole; EGFP = enhanced green fluorescent protein; A.U. = arbitrary units; MCP = MS2 coat protein; RNAPII = RNA polymerase II. Please click here to view a larger version of this figure.
