
FIGURE 3.
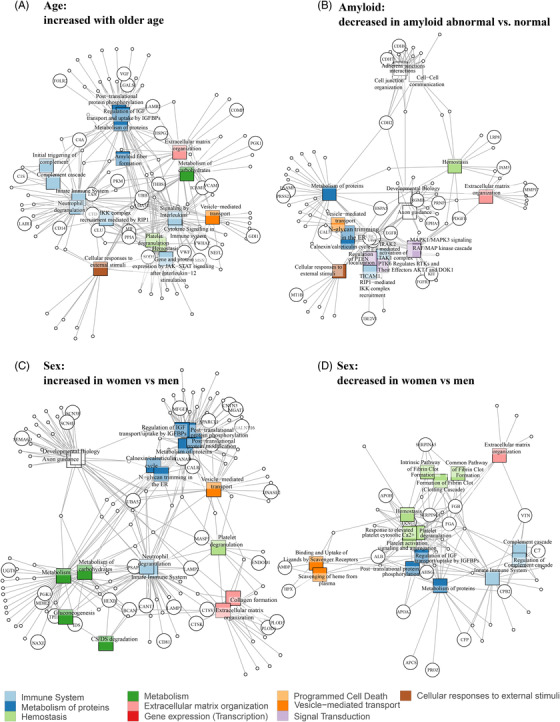
Overview of pathways enriched in proteins related to age, amyloid status and sex. Network graph showing connections between pathways (squares) and proteins found in each analysis (circles), with edges indicating that proteins are part of a pathway. An overview of top pathways and proteins is shown for each analysis; for full pathway results, see Table S4. Pathway results for (A), proteins that showed increased levels with older age, (B) proteins that showed decreased levels in amyloid abnormal versus normal participants, (C), proteins that had increased levels in women versus men, and (D), proteins that had decreased levels in women versus men.