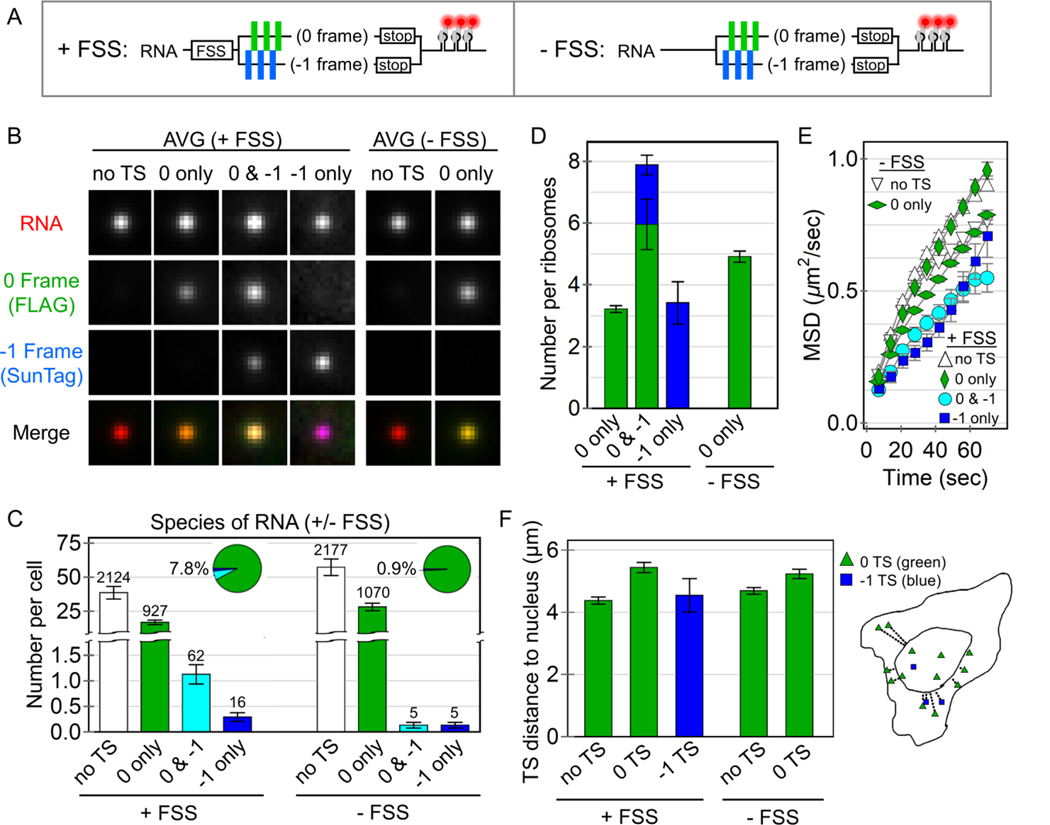
Figure 2. Quantification of HIV-1 stimulated frameshifting.
(A) A schematic of the multi-frame (+FSS) and control (−FSS) reporters. (B) Average image trims of all non-translating RNA sites (no TS), 0 frame translation sites (TS), 0 & −1 TS, and −1 TS, with their respective merges. (C) The number of RNA detected per cell transfected with either the +FSS reporter (60 cells, 3129 total RNA) or the control −FSS reporter (49 cells, 3257 total RNA). The pie charts show the percentage of translating species per transfected cell. The number of detected RNA for each species is shown above each bar. Error bars represent S.E.M. among cells. (D) The number of detected ribosomes per translation site for the +FSS and –FSS reporters. Error bars represent S.E.M. among RNA. (E) The mean squared displacement (MSD) of tracked RNA species as a function of time. Error bars represent S.E.M. among RNA. (F) The average distance (μm) of detected translation sites from the nucleus. An outline of a representative cell on the right shows all detected RNA within the cell and their measured distance from the nuclear border (inner curve).

