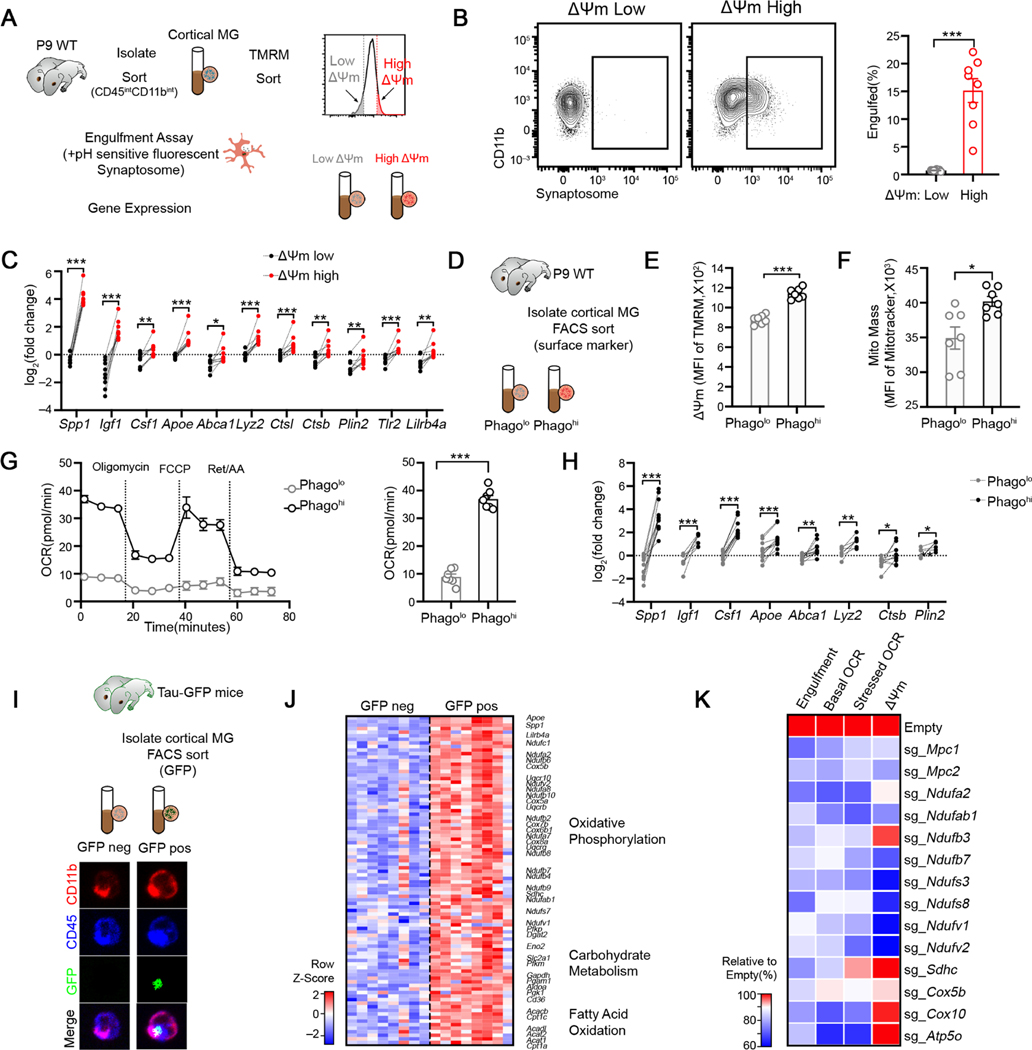
Figure 1. Mitochondrial bioenergetics and phagocytic activity are functionally coupled in cortical microglia during neurodevelopment.
(A) Schematic strategy to sort low-ΔΨm and high-ΔΨm microglia subsets for analyses.
(B) Representative FACS plot and quantification of cell fraction that has engulfed synaptosome in indicated ΔΨm microglia subsets (n = 8).
(C) qPCR analyses of selected genes in indicated ΔΨm microglia subsets isolated from P9 cortices (n = 9 mice).
(D) Schematic strategy to enrich Phagolo and Phagohi microglia subsets.
(E-F) Quantification TMRM (E) and MitoTracker Green (F) staining in indicated microglia subsets (n = 7).
(G) Oxygen consumption rate of indicated microglia subsets analyzed by Mito Stress test assay (n = 7, representative of 2 experiments).
(H) qPCR analyses of selected genes in indicated microglia subsets isolated from P10 cortices (n = 6–12).
(I) Schematic strategy to enrich microglia that are more potent to engulf neuronal debris in vivo. Bottom: representative images of sorted GFP+ and GFP− microglia isolated from P10 mice carrying Tau-GFP (Scale bar = 10μm). GFP signals were observed inside microglia.
(J) Heatmap depicting the relative expression of genes involved in bioenergetic metabolism from Tau-GFP+ and Tau-GFP− microglia. All genes listed are differentially expressed between two genotypes with FDR < 0.05.
(K) Relative engulfment capacity, basal and stressed OCR and ΔΨm of BV2 cells transduced with Cas9-GFP only or Cas9-GFP-sgRNAs targeting metabolic enzymes and transporters. All values are normalized to the mean value of Cas9-GFP-Empty group. Data is pooled from at least 2 experiments and all changes are significant with p < 0.05.
Statistics: mean ± SEM (B, E and F), mean ± SD (G); unpaired student’s t test (B, E, F and G), paired student’s t test (C and H), one-way ANOVA test (K); *p<0.05, **p<0.01, ***p<0.001.

