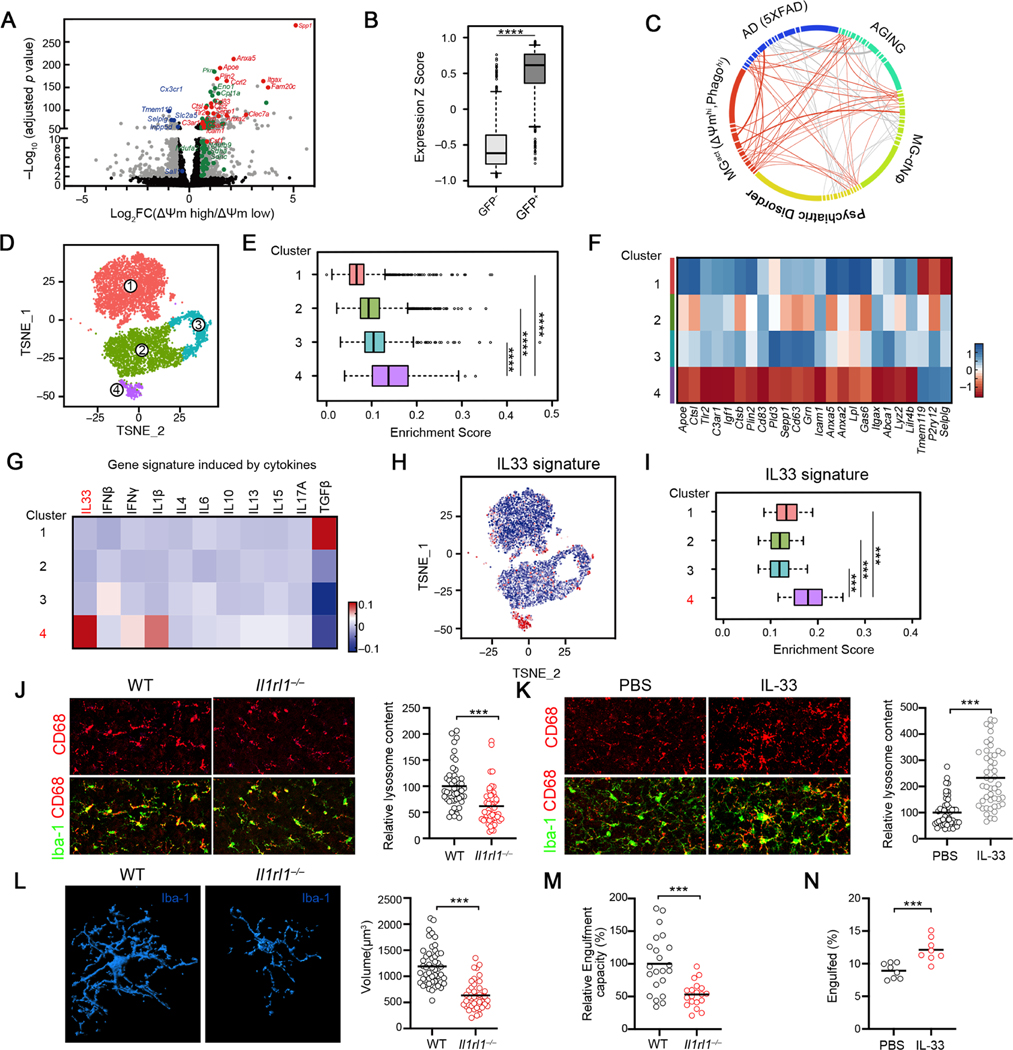
Figure 2. Identification of an IL33-dependent gene program that is associated with microglial function and activity in the developing brain.
(A) Volcano plot depicting transcriptional profiles of ΔΨmhi vs ΔΨmlo microglia subsets. Grey: all differentially expressed genes (fold change ≥ 1, adjusted p < 0.05); red: activation markers; green: homeostatic markers.
(B) Distribution of the relative expression of ΔΨmhi gene signature in Tau-GFP+ and Tau-GFP- microglia. (****p <10−12).
(C) Graphical representation of similarities between the microglia activation signature (MGact) and transcriptomic signatures from mouse AD model, aging and human psychiatric disorder module. Each line represents an overlap, and the thickness of lines is coded by the number of genes overlapped. Genes/connectivity associated with MGact signature is depicted in orange.
(D) t-SNE plot showing 4 microglial clusters from P9 and P28 cortices identified by scRNA-seq.
(E) Distribution of MGact expression among the 4 single cell clusters.
(F) Heatmap depicting the relative average expression of selective microglial activation genes that were enriched in Cluster 4, in comparison to other clusters.
(G) Heatmap depicting relative expression of gene sets induced by indicated cytokines. IL33 gene signature was significantly enriched in Cluster 4 (p < 3.1 × 10⁻¹²).
(H) t SNE visualization of the single microglia, colored by IL33 induced gene signature derived from primary mouse microglia in vitro.
(I) Distribution of the relative expression of IL33 gene signature in the 4 single cell clusters. IL-33 gene signature was defined as genes significantly induced by IL-33 in primary microglia.
(J) Representative images and quantification of microglia engulfment capacity as measured by lysosomal content within each microglia (CD68 immunoreactivity per cell) in the somatosensory cortex of WT and Il1rl1−/− mice at P9 (Scale bar = 50μm). Data is normalized to WT (n = 49, 52; pooled from 3–5 mice/group).
(K) Representative images and quantification of lysosome content of microglia in the somatosensory cortex of WT mice injected with IL-33 vs PBS (Scale bar = 50μm). Data is normalized to PBS group (n = 50,48; pooled from 6 mice/group).
(L) Representative 3D reconstructions of Iba1-stained microglia residing in the somatosensory cortex of WT or Il1rl1−/− mice at P17 (Scale bar = 10μm). Cellular volume is quantified on the right side (n = 50, 41; pooled from 3–5 mice/group).
(M) Quantification of microglia engulfment capacity measured by engulfment index (the ratio of engulfed synaptic debris volume to the total volume of microglia) of microglia in the somatosensory cortex of WT or Il1rl1−/− mice at P17. Data is normalized to WT (n = 49, 52; pooled from 3–5 mice/group).
(N) The percentage of microglia engulfed synaptosome at indicated conditions (n = 8). Statistics: middle line: mean, box edges: 25th and 75th percentiles, whiskers: extend to 5th to 95th percentile (B, E and I); middle line: mean (J-N); student’s t test (B and J-N), one-way ANOVA test (E, G and I); ***p<0.001, ****p <10−12.

