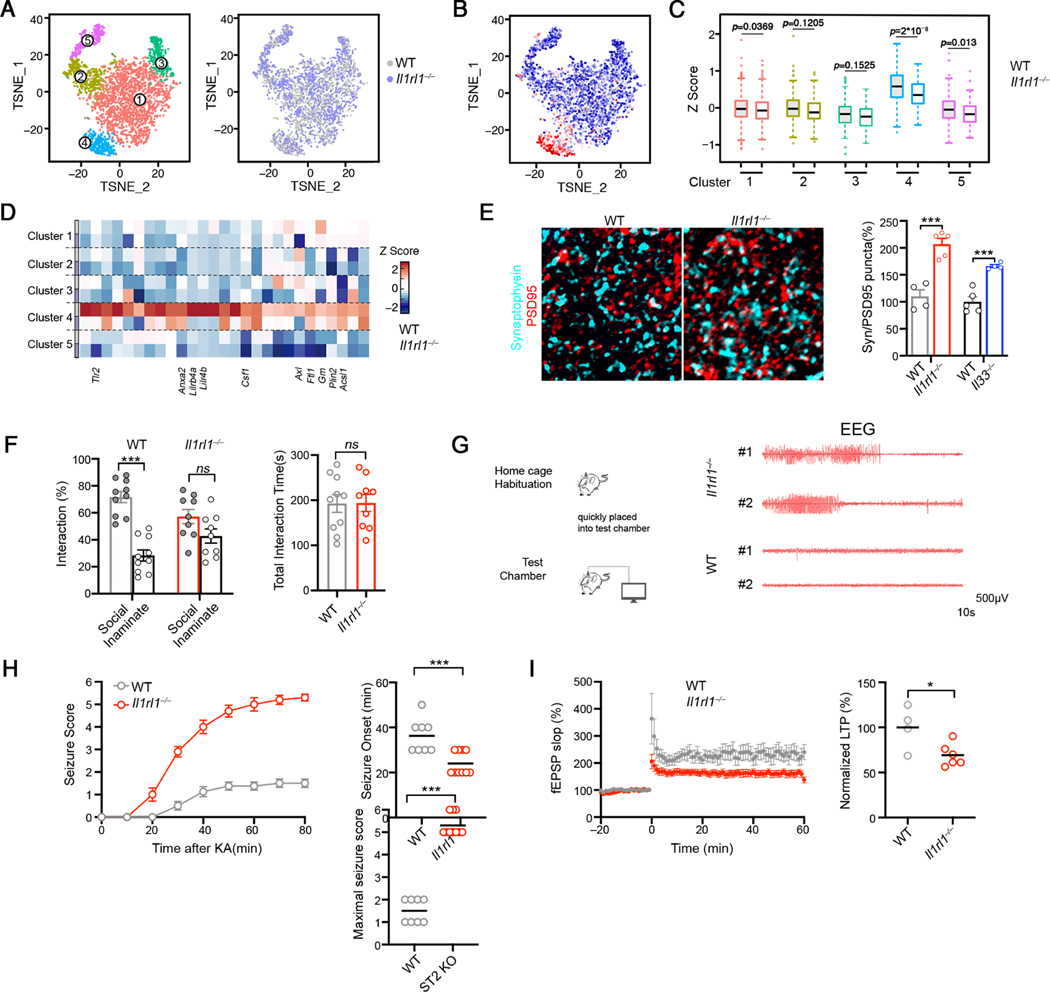
Figure 3. The IL-33-ST2 axis fine-tunes microglial function and regulates synaptic connectivity in vivo.
(A) tSNE visualization of microglia isolated from WT and Il1rl1−/− cortex at P9. Single cells are colored by the partitioning into 5 clusters or genotype.
(B) tSNE visualization of the single microglia, colored by IL-33 induced gene signature.
(C) Distribution of IL-33 induced gene signature expression in the 5 clusters from WT and Il1rl1−/− microglia.
(D) Heatmap depicting the relative average expression of selected IL-33 induced genes in the 5 single cell clusters identified in (A).
(E) Representative images showing staining for Synaptophysin (cyan) and PSD-95 (red) in the somatosensory cortex of WT and Il1rl1−/− mice at P17 (Scale bar =10μm). Quantification of colocalized pre-and postsynaptic puncta is shown on the right.
(F) Three-chamber test evaluating sociability of WT and Il1rl1−/− mice. Left: social preference index; right: the total object investigating time.
(G) Representative EEG recordings in Il1rl1−/− and WT mice.
(H) Seizure severity score following kainic acid injection to WT and Il1rl1−/− mice at P28-P35. Onset of seizure is quantified on the right (n = 7, 10).
(I) LTP induction in the CA1 area as measured using field recordings in the brain slices from WT and Il1rl1−/− mice. Summary of normalized LTP between 50 and 60 min of the recording is plotted on the right (pooled from 4–6 brain slices from 3 experiments).
Statistics: middle line: mean, box edges: 25th and 75th percentiles, whiskers: extend to 5th to 95th percentile (C); mean ± SEM (E, F and H); middle line: mean (H-I); student’s t test (E, F, H and I), one-way ANOVA test (C), two-way ANOVA test (F); ns: not significant, *p<0.05, ***p<0.001.

