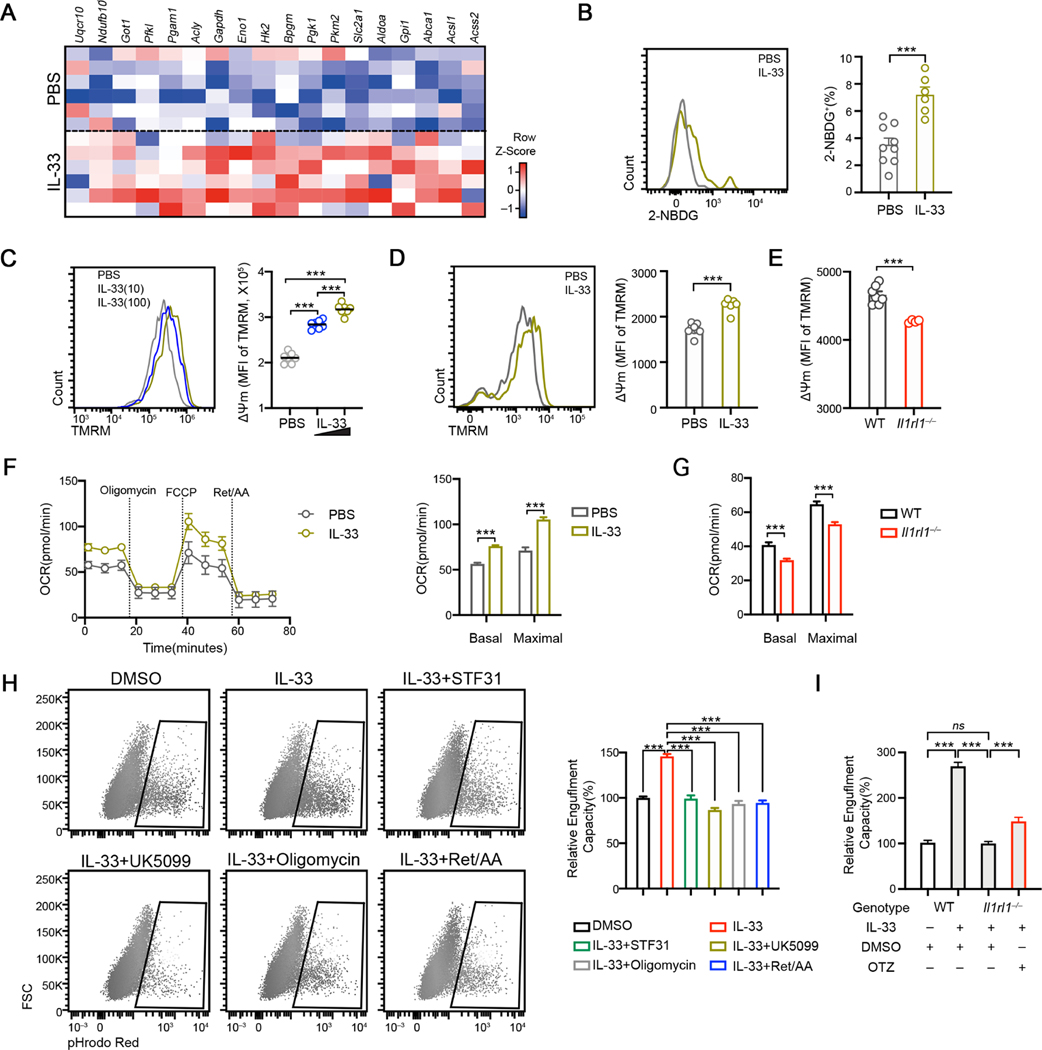
Figure 4. IL33-dependent mitochondrial bioenergetics promotes microglia engulfment.
(A) Heatmap depicting the relative expression of selective metabolic genes induced by IL-33 in primary microglia.
(B) 2-NBDG uptake by cortical microglia isolated from PBS and IL-33 administered mice at P9 (n = 6, 9).
(C) Quantification of TMRM MFI in primary rat microglia stimulated with 10ng/mL and 100ng/mL IL-33 for 12hrs (n = 7).
(D) TMRM staining on cortical microglia isolated from P9 mice injected with PBS and IL33 (n = 6).
(E) TMRM staining in cortical microglia isolated from WT and Il1rl1−/− mice at P9 (n = 7, 4).
(F) OCR of microglia under indicated conditions analyzed by Mito Stress test assay (n =12, representative of 2 experiments).
(G) Basal and stressed OCR of cortical microglia isolated from WT and Il1rl1−/− brains at P9 (n =12).
(H) Representative FACS plots and quantifications of engulfed synaptosome percentage in BV2 cells under indicated conditions (n = 11–30, pooled from 4 experiments).
(I) Engulfment capacity of WT and Il1rl1−/− BMDM as measured by engulfed synaptosome percentage at indicated conditions (n = 6, 6, 17, 16; pooled from 2 experiments).
Statistics: mean ± SEM (B, D, E, H and I); middle line: mean (C); mean ± SD (F and G); student’s t test (B, D, E, F and G), one-way ANOVA test (C, H and I); ***p<0.001.

