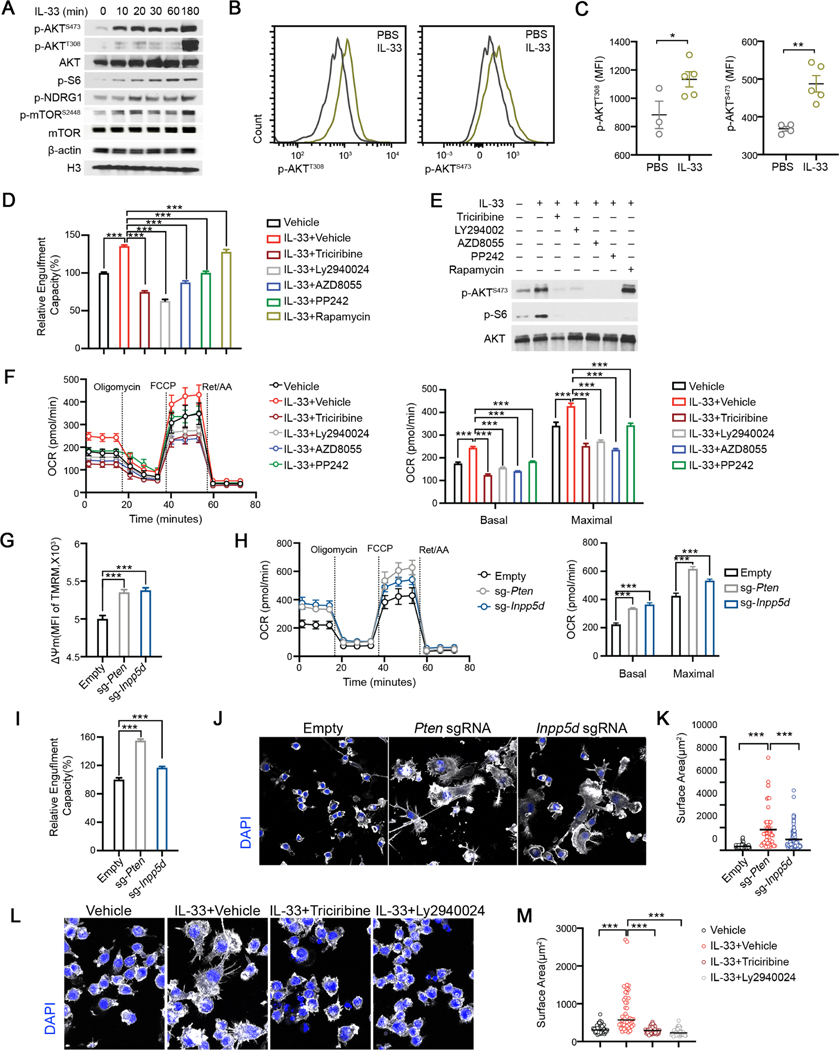
Figure 5. AKT mediates IL-33-enhanced bioenergetics and morphological remodeling to promote synaptosome engulfment activity.
(A) Immunoblots of p-AKT, pS6, pNDRG1 and p-mTOR in BV2 from indicated time points. (B-C) Representative FACS plots (B) and geometric mean fluorescence intensities (C) of p-AKT (T308) and p-AKT (S473) in cortical microglia isolated from P9 mice injected with PBS and IL-33 (n = 3–5).
(D) Relative phagocytic activity of BV2 cells under indicated conditions. Data is normalized to the vehicle group (n = 47, 61, 9, 10, 20, 45, 9; pooled from 4 experiments).
(E) Immunoblots of p-AKT, total AKT and p-S6 under indicated conditions.
(F) OCR of BV2 cells under indicated conditions analyzed by Mito Stress test assay (n = 10, representative of 2 experiments).
(G) MFI of TMRM staining in BV2 cells transduced with sgRNAs targeting Inpp5d and Pten (n = 8, 11, 11; representative of 3 experiments).
(H) OCR of BV2 cells transduced with sgRNAs targeting Inpp5d and Pten analyzed by Mito Stress test assay (n = 24, 15, 8; representative of 2 experiments).
(I) Relative fraction of cells engulfed synaptosomes in BV2 transduced with sgRNAs targeting Inpp5d and Pten. Data is normalized to the empty vector group (n = 22, 11, 20; representative of 5 experiments).
(J-K) Phalloidin (white) and DAPI (blue) staining on BV2 cells transduced with sgRNAs targeting Inpp5d and Pten (Scale bar = 20μm). Surface area of Phalloidin staining is enumerated in (K) (n = 105, 56, 127; representative of 2 experiments).
(L-M) Phalloidin (white) and DAPI (blue) on BV2 cells under indicated conditions (Scale bar= 20μm). Surface area of Phalloidin staining is quantified in (M) (n = 65, 46, 57, 58; representative of 2 experiments).
Statistics: mean ± SEM (C, D, G and I); middle line: mean (K and M); mean ± SD (F and H); student’s t test (C), one-way ANOVA test (D, F, G, H, I, K and M); * p<0.05, **p<0.01,
***p<0.001.

