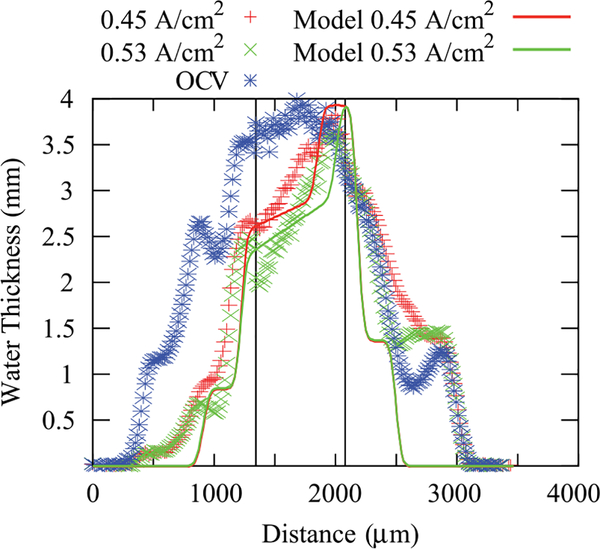
FIG. 11.
Comparison of the through-plane water content in hydrogen pump mode between model and data at three operating current densities. The model computes only the membrane water content; the measured saturation in the GDL region is included, so that the image simulation yields a more realistic transition between the GDL and the membrane. The vertical lines denote the boundary between the MEA and the GDLs; the anode GDL and channel region ranges from 320 μm to 1360 μm the cathode GDL and channel region ranges from 2240 μm to 3040 μm.

