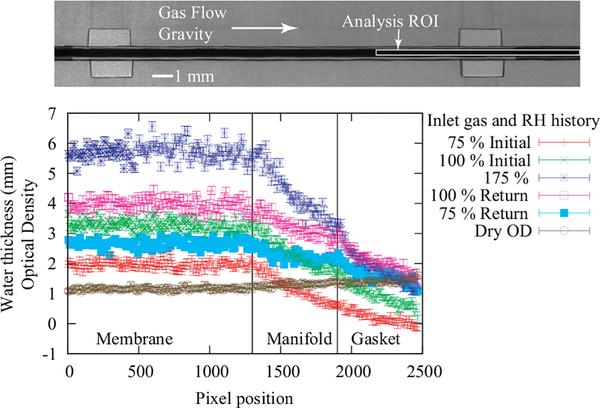
FIG. 8.
Top, raw image of the test section for a free-swelling membrane, showing the direction of the gas flow and gravity, as well as indicating the region of the membrane used to generate the water profiles shown below. Bottom, membrane water content at 80 °C under a compression pressure of 1.4 MPa compression in a test section composed of metal foam flow fields and the optical density of the dry image from the flat field normalization. The region over which the membrane water content and the gasket water content were measured are indicated (see also Figure 6). During the measurement, the water content increases under the gasket region due to in-plane water diffusion; this must be accounted for when calculating the water content in the active area of the flow field.

