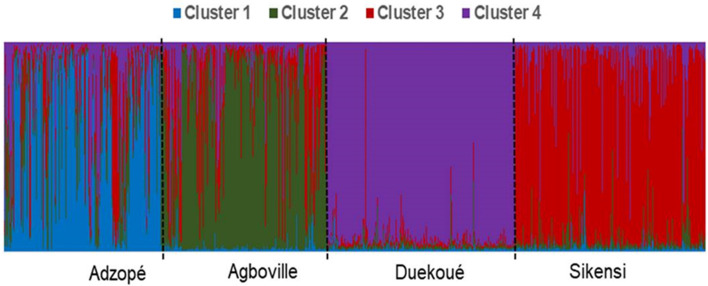
Figure 4.
Bar plot depicting the genetic population structure of 1966 Schistosoma miracidia from the four sampling sites in Côte d’Ivoire produced by Structure for K = 4. Each column represents one miracidium, with colors indicating the proportional contribution of each of the four identified genetic clusters.

