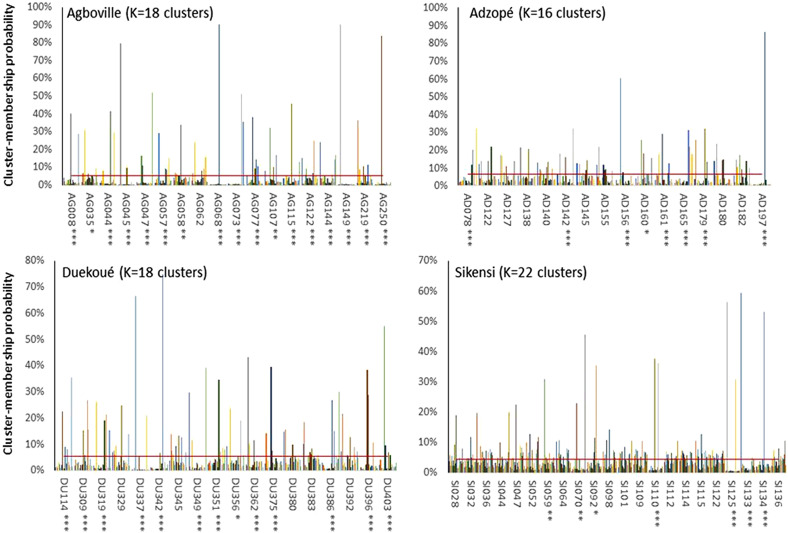
Figure 5.
Genetic clustering produced by Structure software for each population with K = number of patients. The patient codes are in abscises. *, ** and *** represent statistical difference from random repartition among the clusters at the 5%, 1% and 0.1% levels, respectively. The red line represents the null hypothesis of random repartition (1/K).

