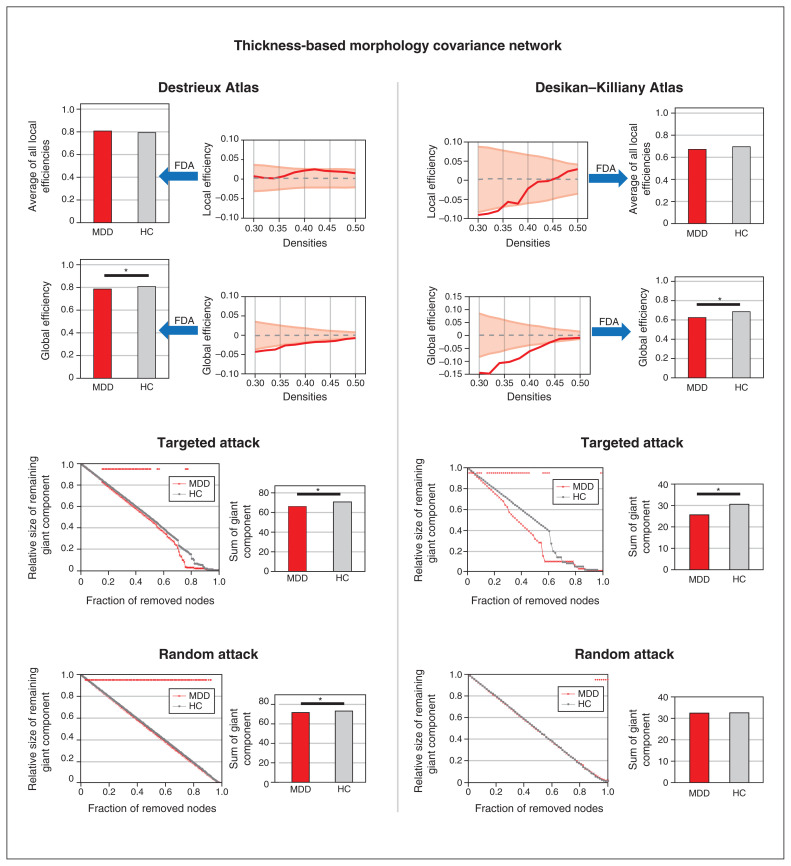
Figure 1.
Topological properties and simulated lesion analysis of the thickness-based covariance network. The left panel shows the results of the morphology covariance network constructed on the Destrieux Atlas with 148 regions of interest. The right panel shows the results of the morphology covariance network constructed on the Desikan–Killiany Atlas with 68 regions of interest. The first row shows the results of comparing the average of local efficiencies between patients with first-episode MDD and healthy controls; we detected no significant differences. The second row shows the results of comparing global efficiency between patients with first-episode MDD and healthy controls; we detected a consistently significant difference in both atlases. The third row shows the results of targeted attack, and the fourth row shows the results of random attack; in patients with first-episode MDD we detected decreased resistance to targeted attack in both atlases, but decreased resistance to random attack only in the Destrieux Atlas. FDA = functional data analysis; HC = healthy control; MDD = major depressive disorder.

