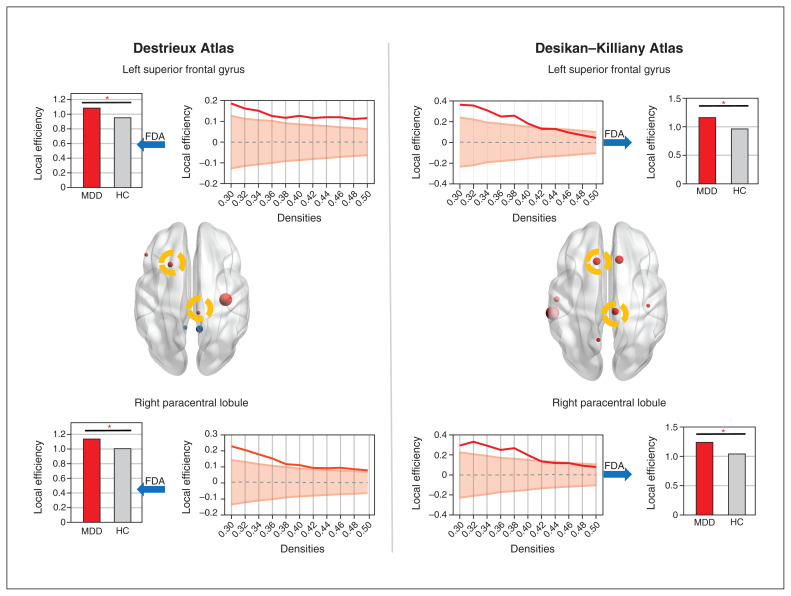
Figure 2.
Nodes with significant altered local efficiency of the thickness-based morphology covariance network. The left panel shows the results of the morphology covariance network constructed on the Destrieux Atlas with 148 regions of interest. The right panel shows the results of the morphology covariance network constructed on the Desikan–Killiany Atlas with 68 regions of interest. The upper row shows increased local efficiency of the left superior frontal gyrus in patients with first-episode MDD. The bottom row shows increased local efficiency of the right paracentral lobule in patients with first-episode MDD. The nodes with increased local efficiency are highlighted in yellow circles in the brain images. FDA = functional data analysis; HC = healthy control; MDD = major depressive disorder.

