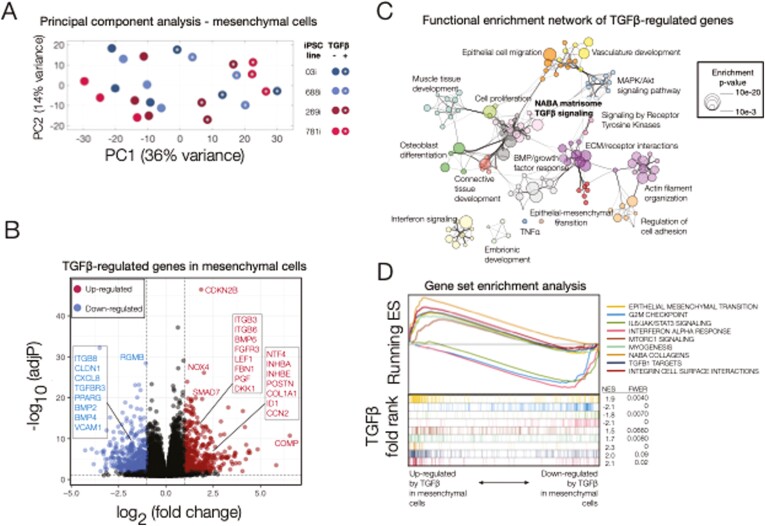
FIGURE 3.
Transcriptional responses to transforming growth factor β (TGFβ) in induced pluripotent stem cell (iPSC)–derived mesenchymal cells. A, Principal component analysis (PCA) of gene expression for TGFβ-treated and untreated mesenchymal cells purified from iPSC-derived human intestinal organoids. The first 2 components (principal component 1 [PC1], PC2) are shown along with the percent of gene expression variance explained. Clustering was obtained using variance-stabilized data after correction for batch- and line-specific baseline expression, and from all expressed human genes without additional filters. Data are representative of 3 independent replicates for each experimental group (24 samples total). B, Volcano plot summarizing the global effect of TGFβ treatment on gene expression levels. Fold changes and adjusted P values correspond to a log-likelihood ratio test (LRT) on treated vs untreated cells independent of source (iPSC line). Highlighted are selected upregulated (red) and downregulated (blue) genes (more than a 2-fold change after TGFβ treatment, LRT-adjusted P <.01). C, Functional enrichment network for all genes differentially regulated by TGFβ (more than a 2-fold change after TGFβ treatment, LRT adjusted P <.01). Individual Gene Ontology terms with similar gene members are grouped by categories (node color) and labeled using a representative member. Node size is proportional to statistical significance (enrichment P value) as shown. Edge thickness is proportional to between-node similarity and reflects the overlap between genes annotated in both ontology terms. Only edges representing a kappa similarity score >0.3 are shown. Only significant ontology terms are shown (hypergeometric-adjusted P value<1 × 10⁻³). Members of selected ontologies are presented in Table 1. D, Gene set enrichment analyses of selected enriched pathways in TGFβ-treated mesenchymal cells. The x-axis represents the preranked list of genes based on the fold change between treated and untreated cells as in B, with genes highly upregulated by TGFβ in our human intestinal organoids positioned to the left. Segment plots (bottom) highlight the position of genes from independent reference pathways (eg, epithelial-mesenchymal transition) in ranked list. The vertical axis in line plots (top) represents the cumulative enrichment score (ES) from gene set enrichment analysis, and normalized ES is the overall normalized enrichment score (with familywise error rate) for each selected pathway. TNFα, tumor necrosis factor α.

