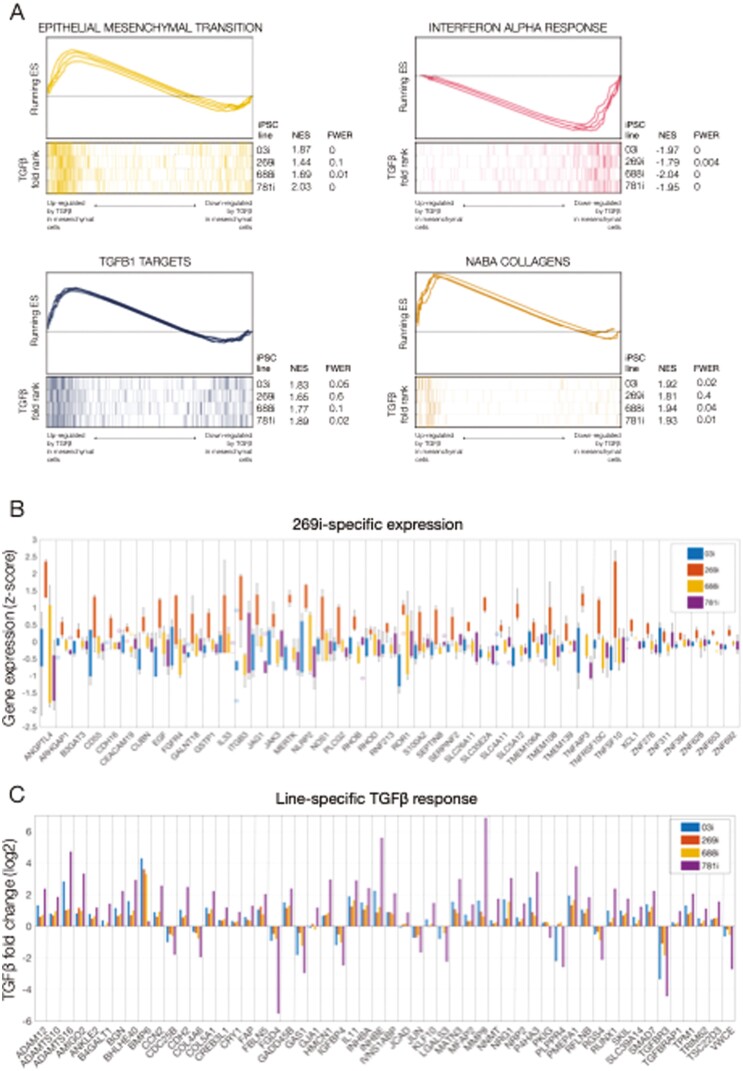
FIGURE 4.
Line-specific transcriptional identity and responses to transforming growth factor β (TGFβ) in induced pluripotent stem cell (iPSC)–derived mesenchymal cells. A, Gene set enrichment analyses of selected enriched pathways in TGFβ-treated mesenchymal cells. The x-axis represents the preranked lists of genes based on the fold change between treated and untreated cells in each iPSC line independently. For each line, genes highly upregulated by TGFβ are positioned to the left. Segment plots (bottom) highlight the position of signature genes from independent reference pathways (eg, epithelial-mesenchymal transition) in each ranked list. The vertical axis in line plots (top) represents the cumulative enrichment score (ES) from gene set enrichment analysis of each signature set in each iPSC line. Normalized ES (NES) is the overall normalized ES (with familywise error rate [FWER]) for each selected pathway and iPSC line. B, Gene-wise boxplots of expression z-score distributions for selected genes showing line-specific expression in the 269i very early onset inflammatory bowel disease line. Each box represents a gene’s z-score distribution for all samples in 1 experimental group (3 replicates per experimental group). C, Gene-wise barplots of expression fold-changes for selected genes showing line-specific responses to TGFβ. Each bar represents a gene’s fold change after TGFβ treatment obtained from each iPSC line independently.

