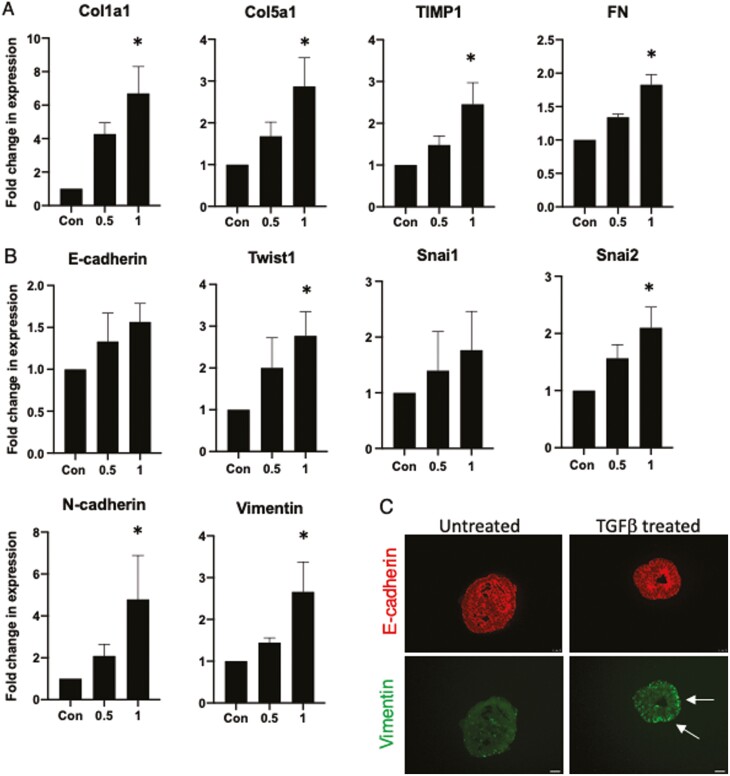
FIGURE 5.
Characterization of fibrotic and epithelial-mesenchymal transition in transforming growth factor β (TGFβ)–treated induced pluripotent stem cell–derived epithelial cells. Fold change increases in (A) Col1a1, Col5a1, FN, and TIMP1 and (B) E-cadherin, Twist1, Snai1, Snai2, N-cadherin, and vimentin. Cells were assessed after 48 hours of 0ng/mL, 0.5ng/mL, and 1ng/mL of TGFβ treatment. Data obtained from 3 independent experiments. C, Representative images showing epithelial-only human intestinal organoids after 48 hours of TGFβ (1ng/mL) treatment and are immunopositive for E-cadherin (red) and vimentin (green). Scale bar=25 µm. The white arrow points to coexpression of E-cadherin and vimentin. A Kruskal-Wallis test was carried out to determine for statistical significance at the different concentrations of TGFβ as compared with each respective untreated control subject. ∗P < .05.

