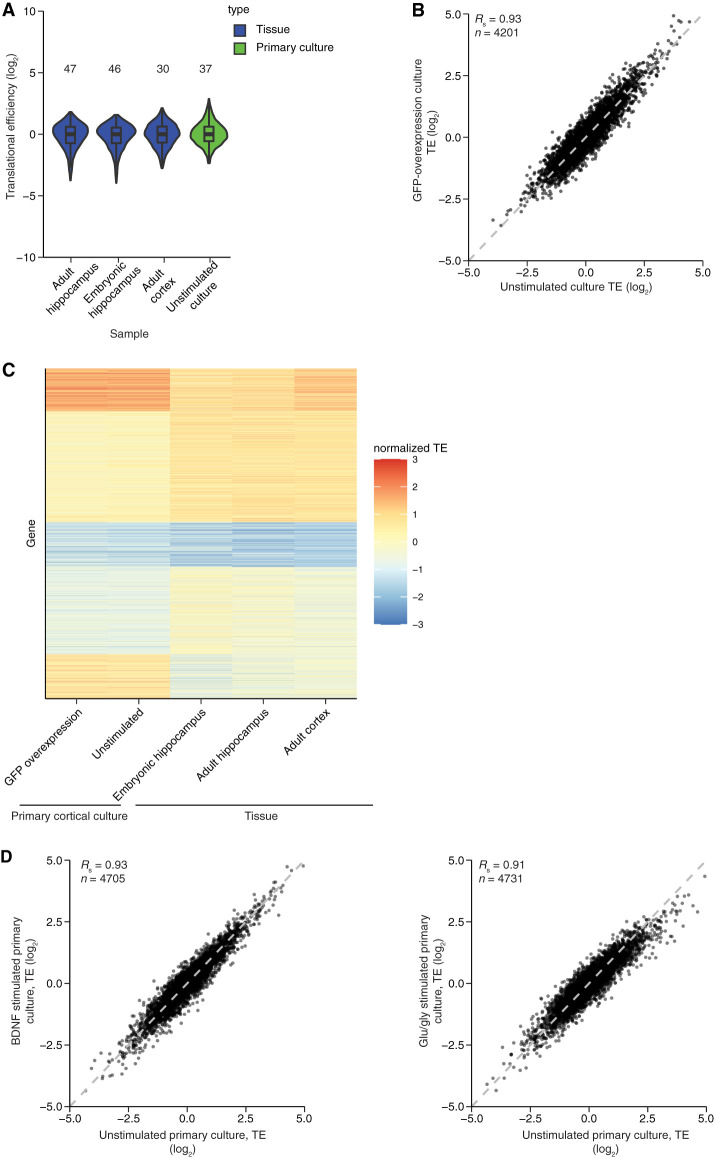
FIGURE 2.
TE values from neuronal tissues and cultures with and without stimulation. (A) Ranges in TE values acquired for unstimulated neuronal samples in this study. The 1–99 percentile range is printed above the distribution. Values are from adult hippocampus (6342), embryonic hippocampus (7443), adult cortex (5019), and unstimulated cortical culture (n = 5129). Otherwise, this panel is as in Figure 1A. (B) Reproducibility of TE measurements. Shown is the relationship between the TE values for mRNAs from an unstimulated primary cortical culture and those from an analogous culture in which GFP was expressed from a lentiviral vector. (C) Comparison of TE values obtained from different neuronal samples. The heatmap indicates TE values obtained from mRNAs that passed the expression cutoffs in all five of the indicated samples (n = 3347). For each sample, values were z-score normalized and then clustered using k-means. The gene index is plotted as a function of sample and colored by normalized TE (key). (D) Modest effect of stimulation on TE values. Cortical cultures were stimulated with either BDNF (left) or glu/gly (right), and TE values were compared with those observed without stimulation (n = 4705 and 4731, respectively).

