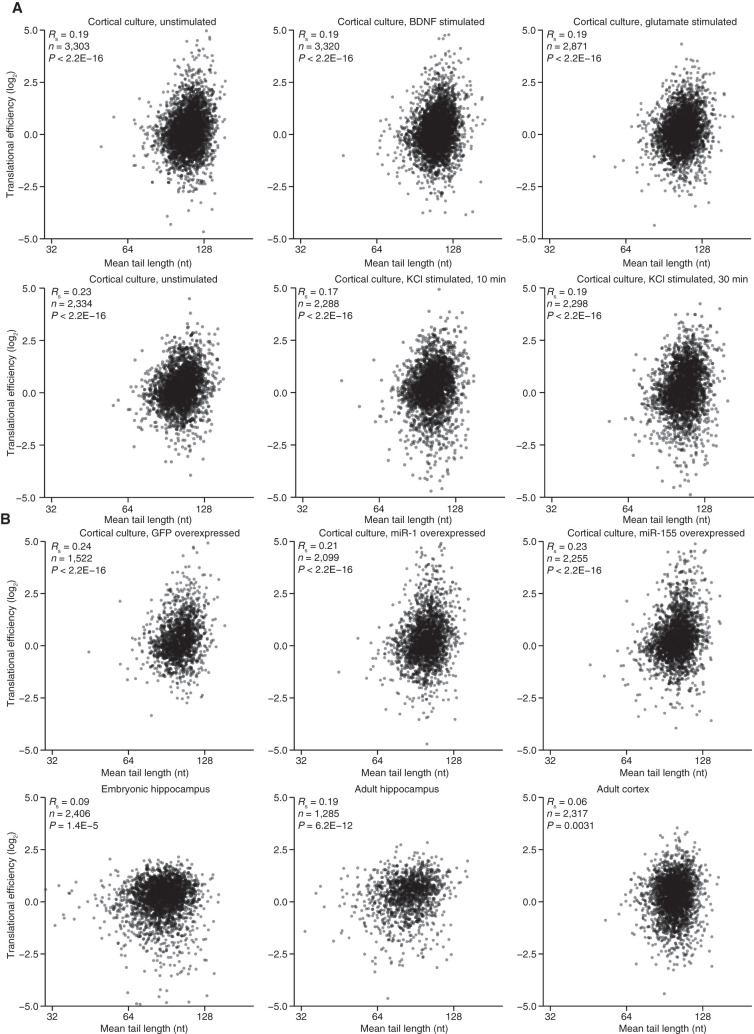
FIGURE 4.
A modest relationship between tail length and TE in primary cortical cultures and tissues. (A) Relationship between TE and mean tail length for mRNAs from each gene that passed expression cutoffs for both measurements. Plotted are results from nine primary cortical cultures examined in this study. (B) Relationship between TE and mean tail length for tissue samples; otherwise as in A.

