FIGURE 6.
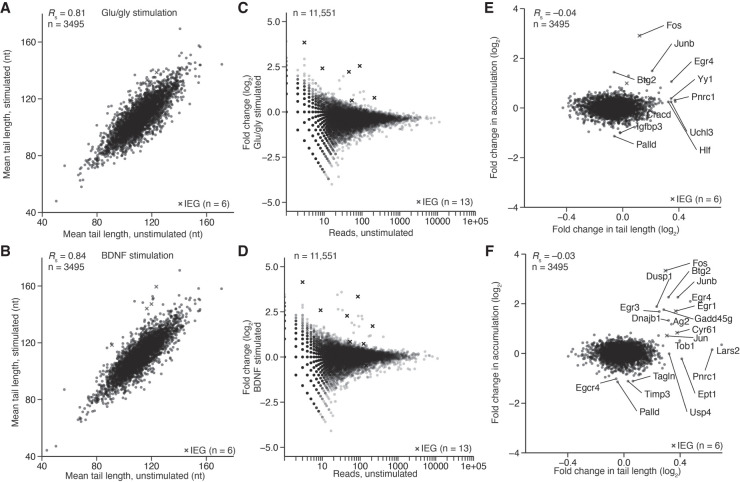
Tail length and expression changes observed during cortical-culture stimulation. (A) The effect of glu/gly stimulation on mean tail lengths. For mRNAs of each gene that passed the 50-tag expression cutoff, mean tail length in the stimulated sample was compared to that in the untreated control. Values for IEGs are indicated with an “x.” (B) The effect of BDNF stimulation on mean tail lengths; otherwise, as in A. (C) The effect of glu/gly stimulation on gene expression, as measured by PAL-seq tags. For mRNA of each gene, the fold-change in tags observed upon stimulation is plotted. Otherwise as in A. (D) The effect of BDNF stimulation on gene expression; otherwise as in C. (E) Comparison of change in expression with change in tail length observed during glu/gly stimulation. Gene labels were added for all points with a log2 fold-change in expression of >1.3 or <−1.0, or log2 fold-change in tail length of >0.3. (F) Comparison of change in expression with change in tail length observed during BDNF stimulation, otherwise as in E.

