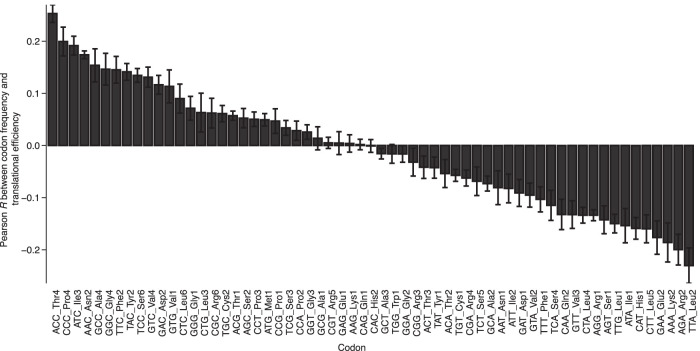
FIGURE 7.
Codon composition explains some of the variation in TE observed in cortical cultures. The relationship between TE and codon frequency was determined for each of the 61 codons, using results from each of the six DIV14 primary-culture samples examined in this study. Plotted for each codon is the mean Pearson R value of the relationship (error bars, standard deviation), arranged in descending order.

