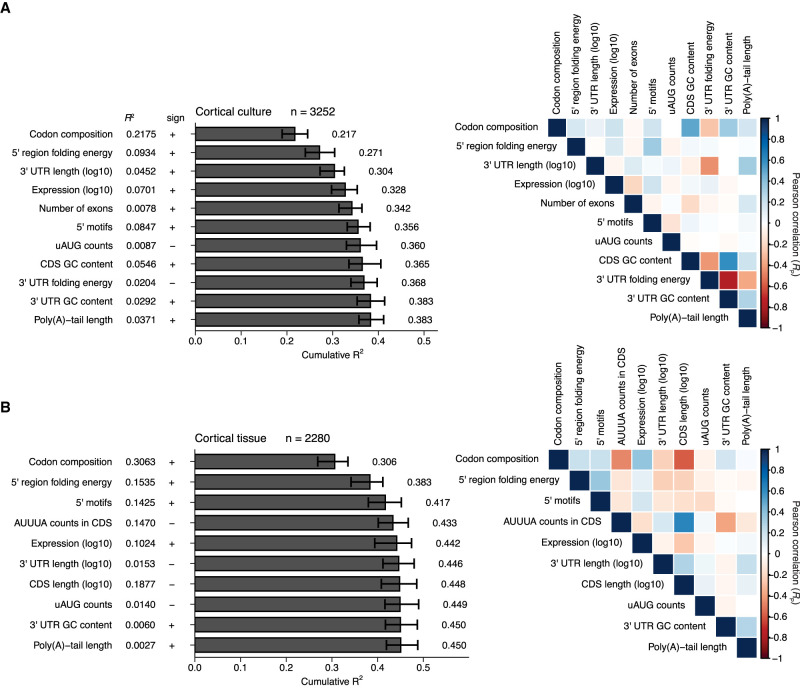
FIGURE 8.
Linear models quantifying correlates of translation in cultured neurons and adult cortex. (A) Model for cultured primary cortical neurons. (Left) Sequence features used to predict TE in a primary cortical culture sample are arranged in the order in which they were selected during stepwise linear regression. Each feature is shown at the left, along with its R2 value in the absence of other features, the sign of its correlation with TE, and a bar plot of the cumulative R2 of a model built using the feature and more predictive features. Error bars indicate the 95% confidence interval on each feature obtained after bootstrapping the data 100 times. (Right) Pearson correlations for pairwise comparisons between each feature selected during the stepwise regression and all other selected features are arranged in a heatmap, with colors indicating the strength of each correlation (key). (B) Model for adult cortex; otherwise as in A.

