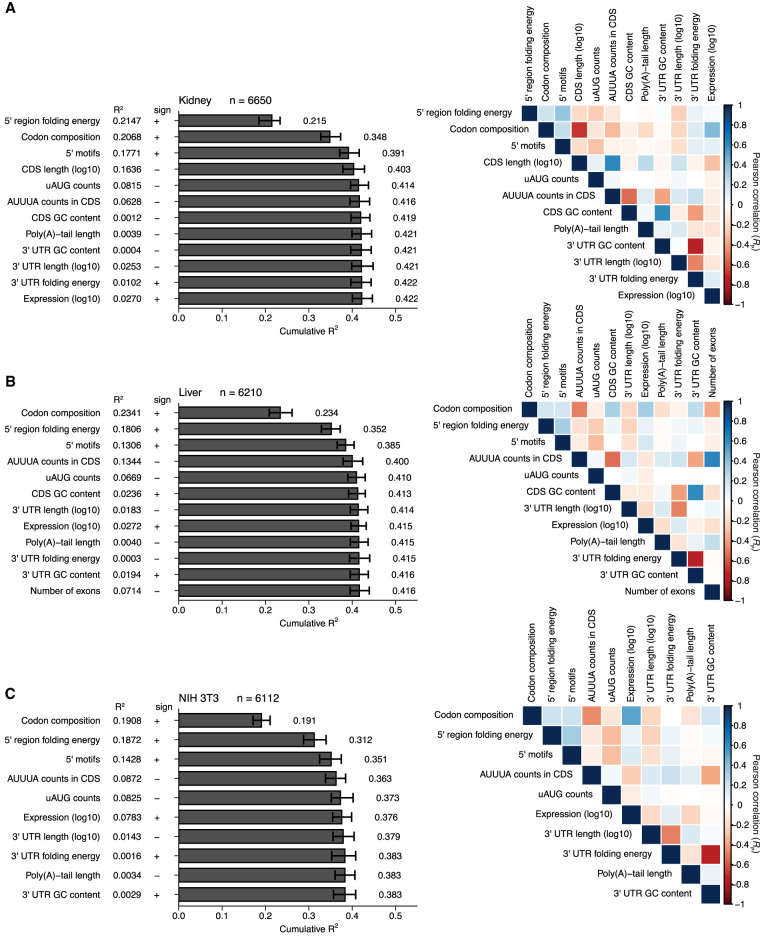
FIGURE 9.
Linear models quantifying correlates of translation in nonneuronal systems. (A–C) Models for mouse kidney (Castelo-Szekely et al. 2017), mouse liver (Janich et al. 2015), and NIH 3T3 cells (Subtelny et al. 2014), respectively. Otherwise, these panels are as in Figure 8.

