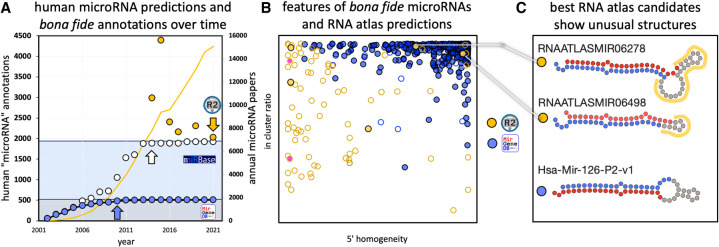
FIGURE 1.
(A) microRNA predictions in miRBase (white), MirGeneDB (blue), and in selected papers (yellow) over time in comparison to the number of annual papers (yellow line) (see Supplemental File 1). A clear near correlation of the number of published papers and annotated microRNAs is detected until 2014 (white arrow, R2 = 0.876), when miRBase introduced high-confidence criteria. The human microRNA complement annotated in miRBase was since then stable at ∼1900 microRNA candidates (light blue area). Note that the curated human microRNA complement (∼500 bona fide microRNAs from MirGeneDB [gray area]) is recovered at 95.2% (480 genes) already by 2010 in miRBase (blue arrow). Several studies predicted substantial numbers of putative novel microRNAs that differ significantly from the putative microRNAs in miRBase and the bona fide microRNAs of MirGeneDB, respectively (yellow dots, see Supplemental File 1; not shown, miRCarta [Backes et al. 2018] with ∼12,000 predictions). Yellow arrow depicts the corresponding numbers for “validated” microRNAs in the RNA atlas from Lorenzi. (B) Comparison of human bona fide microRNA genes as annotated in MirGeneDB (blue) and the novel “validated” microRNA candidates from the RNA atlas (yellow) by mapping of all RNA atlas reads to all precursors (see Supplemental File 2 for summary, Supplemental File 3 for detailed results). Three important annotation criteria based on microRNA biogenesis features were tested: “5′ homogeneity” (x-axis, bona fide microRNAs typically show values beyond 90%), “in cluster ratio” (y-axis, bona fide microRNAs typically show values beyond 90%), and the detection of two precursor arm products that show characteristic RNases derived 2 nt offsets (empty circles: one arm detected, filled circles: two arms detected). Note the few empty circles for MirGeneDB entries that represent either deeply conserved (Hsa-Mir-1307, eutherian), generally lowly expressed (Hsa-Mir-5579), or extremely tissue-specific entries (Hsa-Mir-217, pancreas specific and also deeply conserved) that are detected with both arms in the MirGeneDB data. Pink RNA atlas predictions represent fragments of a previously annotated Y-RNA fragment (R4). (C) The two best RNA atlas candidates as measured by the 3′ feature comparison show strong secondary loop structures (RNAATLASMIR06278), or unusually short loop sizes (RNAATLASMIR06498) in comparison to a representative example from MirGeneDB (Hsa-Mir-126-P2-v1) (red dots mark mature microRNA nucleotides and blue dots star microRNA nucleotides; unusual loop regions are highlighted in yellow).

