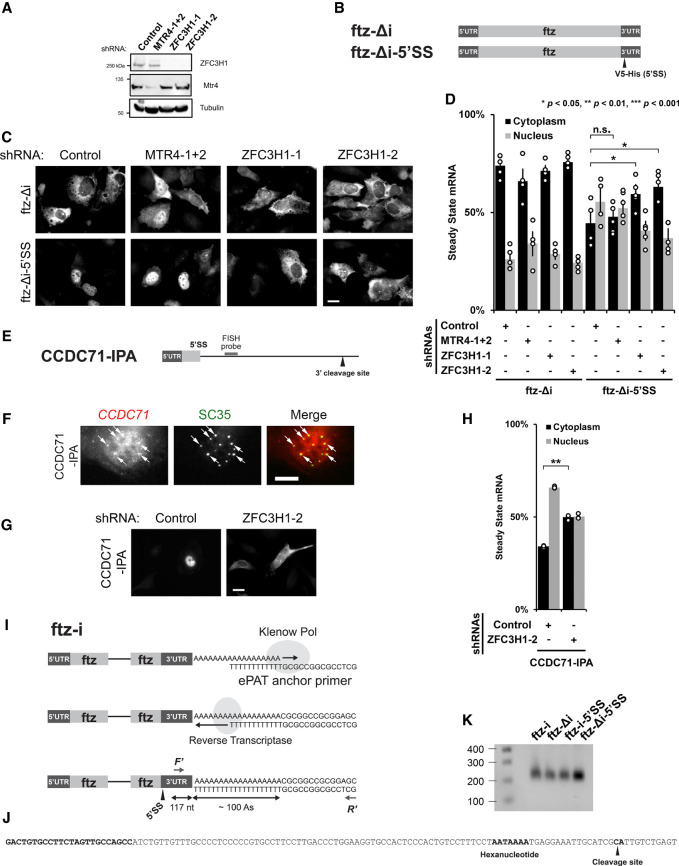
FIGURE 2.
ZFC3H1 is required for the nuclear retention of 5′SS motif containing mRNAs. (A) U2OS cells were treated with different lentivirus shRNAs against ZFC3H1 (“ZFC3H1-1” and “ZFC3H1-2”), MTR4 (“MTR4-1 + 2”) or control shRNA. Lysates were collected 96 h post-transduction, separated by SDS-PAGE and immunoprobed for ZFC3H1, MTR4, or tubulin. Note that to effectively deplete MTR4, cells were treated with lentivirus containing two shRNA plasmids. (B) Schematic of the intronless (Δi) ftz reporter (ftz-Δi) construct used in this study, with and without the V5-His element in the 3′UTR (ftz-Δi-5′SS). Note that the V5-His element contains a consensus 5′SS motif, which promotes nuclear retention. (C,D) Control-, MTR4-, and ZFC3H1-depleted cells were transfected with the intronless ftz reporter plasmid (±5′SS). Eighteen to twenty-four hours later, the cells were fixed and the mRNA was visualized by FISH. Note that depletion of ZFC3H1, but not MTR4, caused the cytoplasmic accumulation of the ftz-Δi-5′SS mRNA. Representative images are shown in C (scale bar, 10 µm) and quantification is shown in D. Each bar represents the average and standard error of at least three independent experiments, each experiment consisting of at least 30 to 60 cells. Student's t-test was performed for Figure 2D. (*) P < 0.05, (**) P < 0.01, (***) P < 0.001. (E) Schematic of CCDC71-IPA reporter used in this study (see also Fig. 1H). The position of the FISH probe used to visualize the IPA RNA is marked in gray and the position of the 3′ cleavage site in the intron is as indicated. (F) U2OS cells were transfected with the CCDC71-IPA reporter and, 18 to 24 hours later, the cells were fixed. The IPA transcript was visualized by FISH and nuclear speckles were visualized by immunofluorescence against SC35. Representative images are shown with a merged overlay showing the CCDC71-IPA mRNA in red and SC35 in green. Scale bar, 10 µM. Examples of CCDC71-IPA/SC35 colocalization are indicated with arrows. (G,H) Control- and ZFC3H1-depleted cells were transfected with the CCDC71-IPA reporter and the IPA transcript was visualized by FISH. ZFC3H1 depletion increased the cytoplasmic accumulation of the CCDC71-IPA. Representative images are shown in G (scale bar, 10 µm) and quantification is shown in H. Each bar represents the average and standard error of at least three independent experiments, each experiment consisting of at least 30 to 60 cells. Student's t-test was performed for Figure 2H. (**) P < 0.01. (I–K) ePAT assay and 3′RACE were used to examine 3′ end processing. (I) Schematic of the ePAT assay as described in Janicke et al. (2012). The ftz-specific (F′) and universal (R′) primers used to amplify the ePAT amplicon are indicated. The sequence of the ePAT amplicon before the cleavage site is shown in J and is 117 nt long. (J) The sequence of the end of the 3′UTR is shown. Indicated in bold are the ftz-specific F′ primer annealing site (used in the ePAT and 3′RACE experiments), the hexanucleotide motif, and the cleavage site (as determined by 3′RACE experiments on mRNAs derived from U2OS cells transfected with either ftz-Δi or ftz-Δi-5′SS). (K) PCR products from the ePAT assay were separated on a 1% agarose gel and stained with ethidium bromide. Lane 1: Molecular weight markers with sizes in bp indicated on the left; lanes 3–6: ePAT amplicons from U2OS cells that were transfected with plasmids containing the indicated versions of the ftz reporter (without [Δi] or with [i] an intron, without or with the 5′SS motif). Note that the amplicons generated from all four reactions are the same length (∼230 nt). Since the amplified region in the 3′UTR is 117 bp long (see J), and the universal primer has a 14 nt extension (see J), the poly(A)-tail is estimated to be ∼100 nt long.

