
Figure 2.
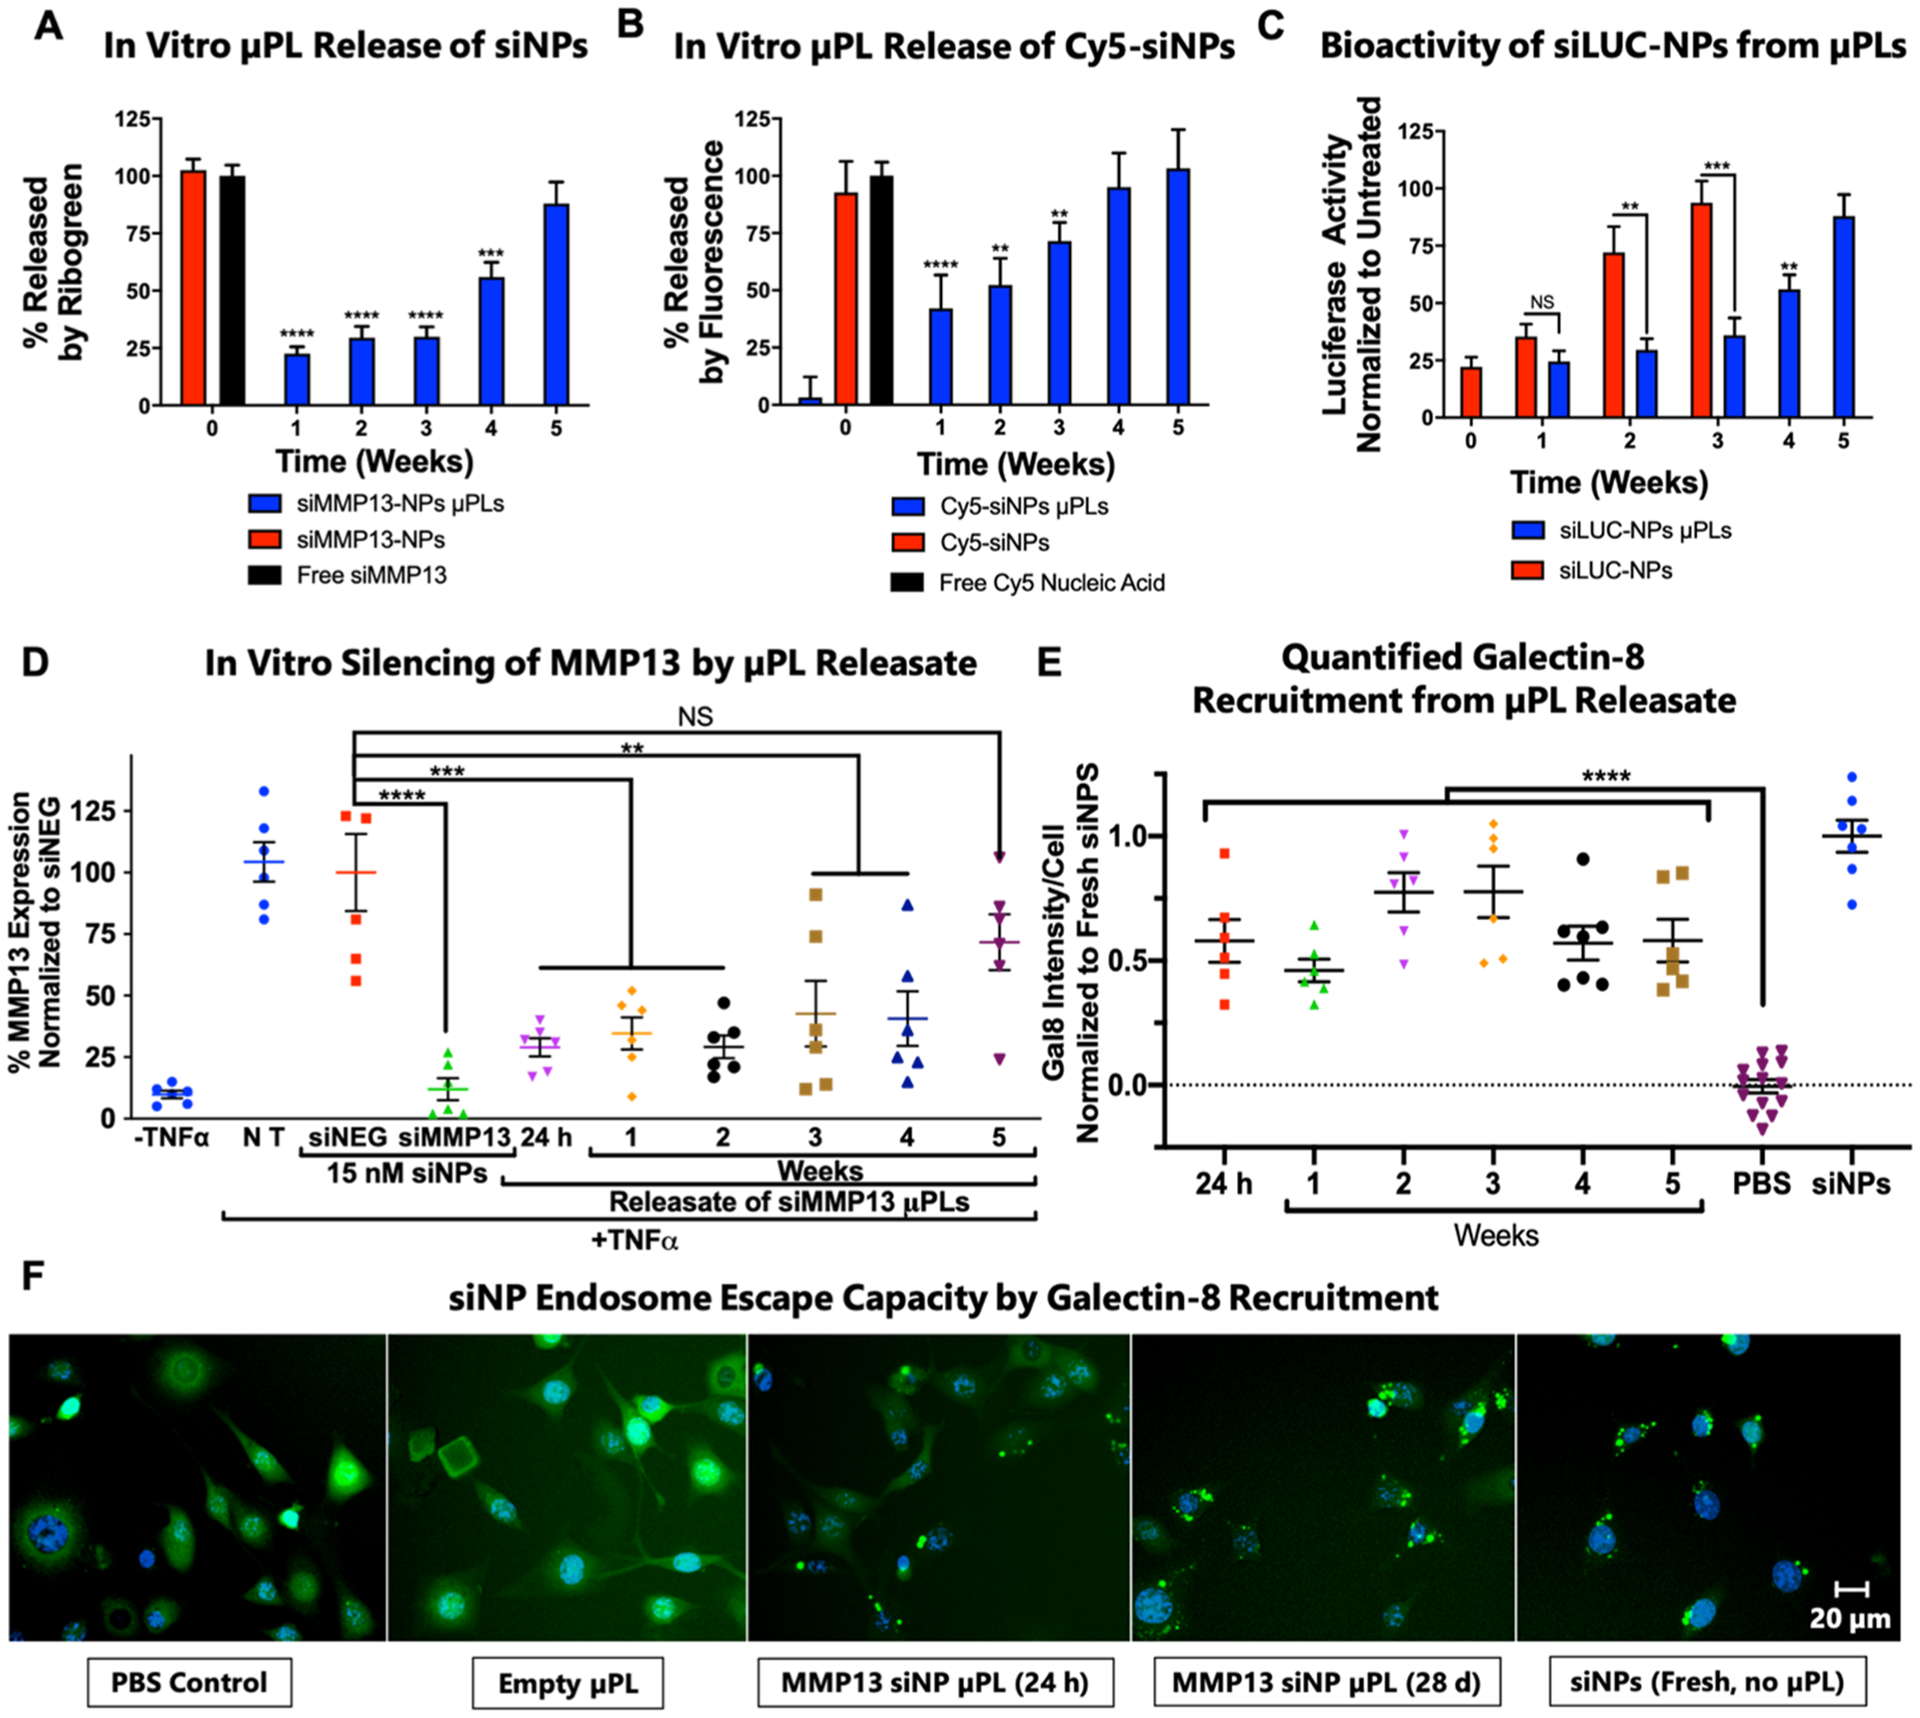
Release kinetics and bioactivity assessment of siNP-μPLs in vitro. (A) siMMP13-NP release profile from μPLs as measured by Quant-iT Ribogreen assay. (B) Cy5-siNP release kinetics from μPLs as measured by Cy5 fluorescence. (C) ATDC5 chondrogenic cell luciferase silencing by siLUC NPs collected over time from μPL releasates or incubation in PBS. (D) Silencing activity of siMMP13-μPL releasates measured by qRT-PCR on chondrogenic ATDC5 cells following stimulation with TNFα (20 ng/mL). (E) Quantification of galectin-8-YFP puncta recruitment as a marker of endosome disruption in cells treated with releasates collected at different time points. Data are normalized to recruitment in cells treated with fresh siNPs. (F) Representative images of galectin-8-YFP concentration (punctate green spots) onto disrupted endosomes (*, p < 0.05; **, p < 0.01; ***, p < 0.001; ****, p < 0.0001; all error bars represent standard error).