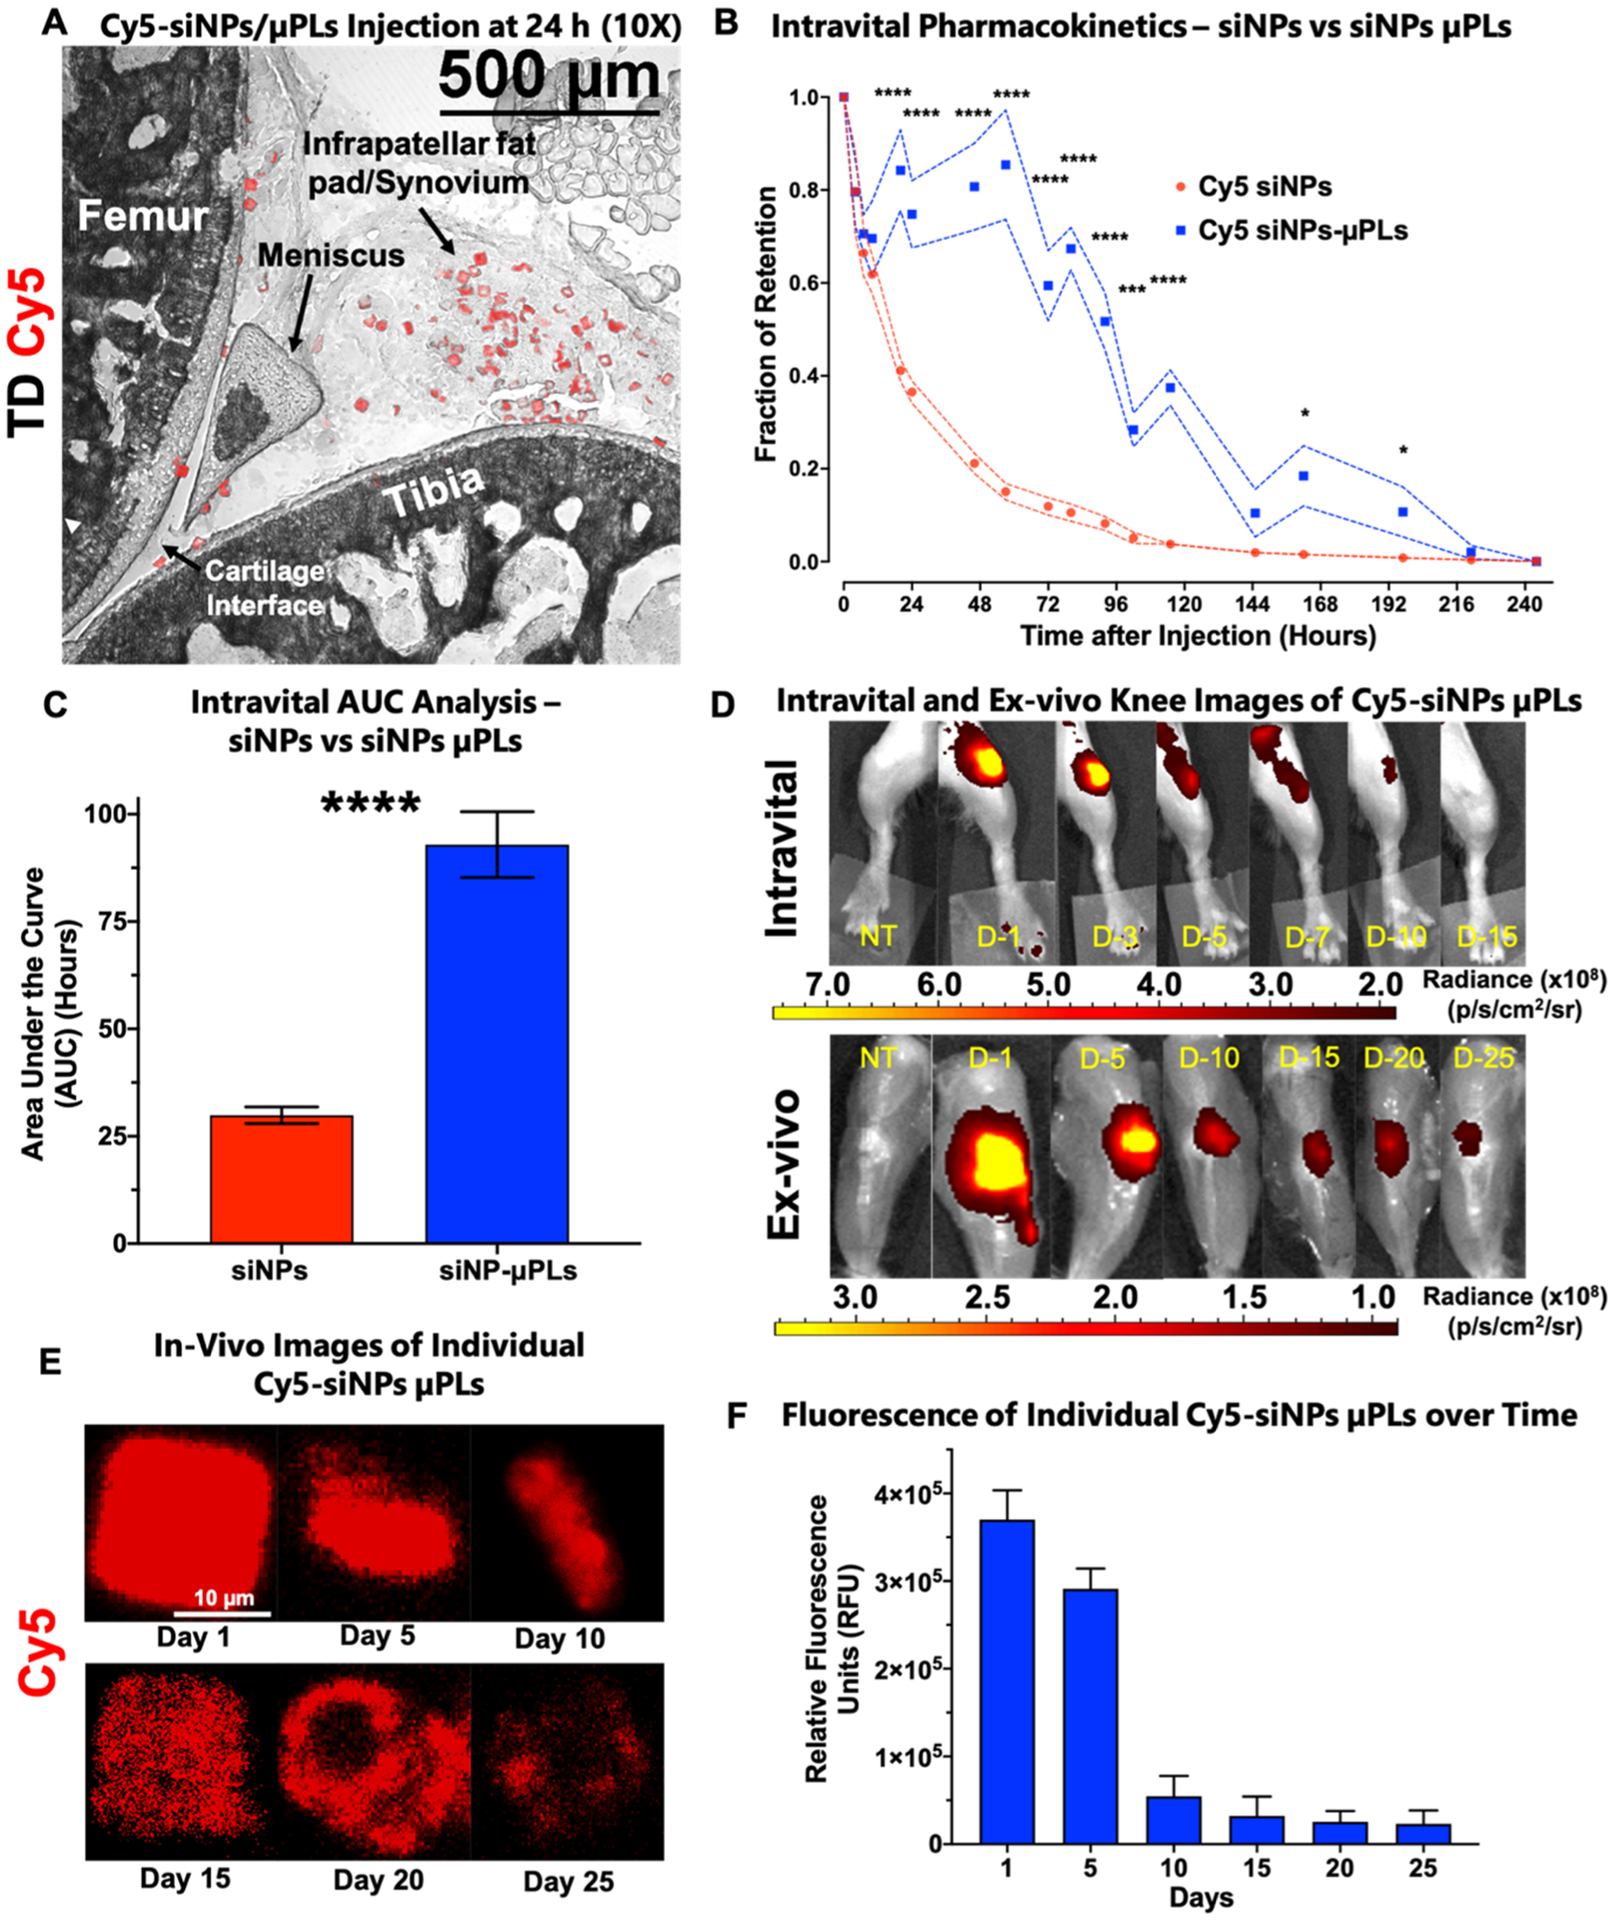
Figure 3.

In vivo pharmacokinetic study of Cy5-siNP-μPLs and Cy5-siNPs in a mouse model of osteoarthritis. (A) Anatomically labeled sagittal cryosection from a mouse joint 1 day after intra-articular injection showing Cy5-siNP-μPLs dispersed across the joint reaching the femoral-tibial cartilage interface, the meniscus, the infrapatellar fat pad, and synovium. (B) Intravital fraction of retention over time of both Cy5-siNPs and Cy5-siNP-μPLs plotted as mean ± SEM (dotted lines). (C) Area under the curve (AUC) analysis of intravital joint pharmacokinetics data plotted as mean ± SEM. (D) Representative intravital (skin on) and ex vivo (skin off) knee images of Cy5-siNP-μPLs over time (D-no. = no. of days after injection). (E) Representative confocal microscopy images of individual Cy5-siNP-μPLs from day 1 to day 25 within the mouse joint. (F) Quantification of relative fluorescence units (RFU) of individual Cy5-siNP-μPLs in histological sections over time plotted as mean + SEM. For intravital imaging analysis, n = 4–24 limbs depending on the time point. Measurements were done on more animals at earlier time points, and the sample size at the later time points was lower because some animals were taken down throughout the course of the study for ex vivo imaging and confocal microscopy analysis. For ex vivo imaging and confocal microscopy analysis, n = 2–4 limbs per time point. TD = transmission detector. NT = no treatment. (*, p < 0.05; **, p < 0.01; ***, p < 0.001; ****, p < 0.0001; all error bars represent standard error).
