Figure 5.

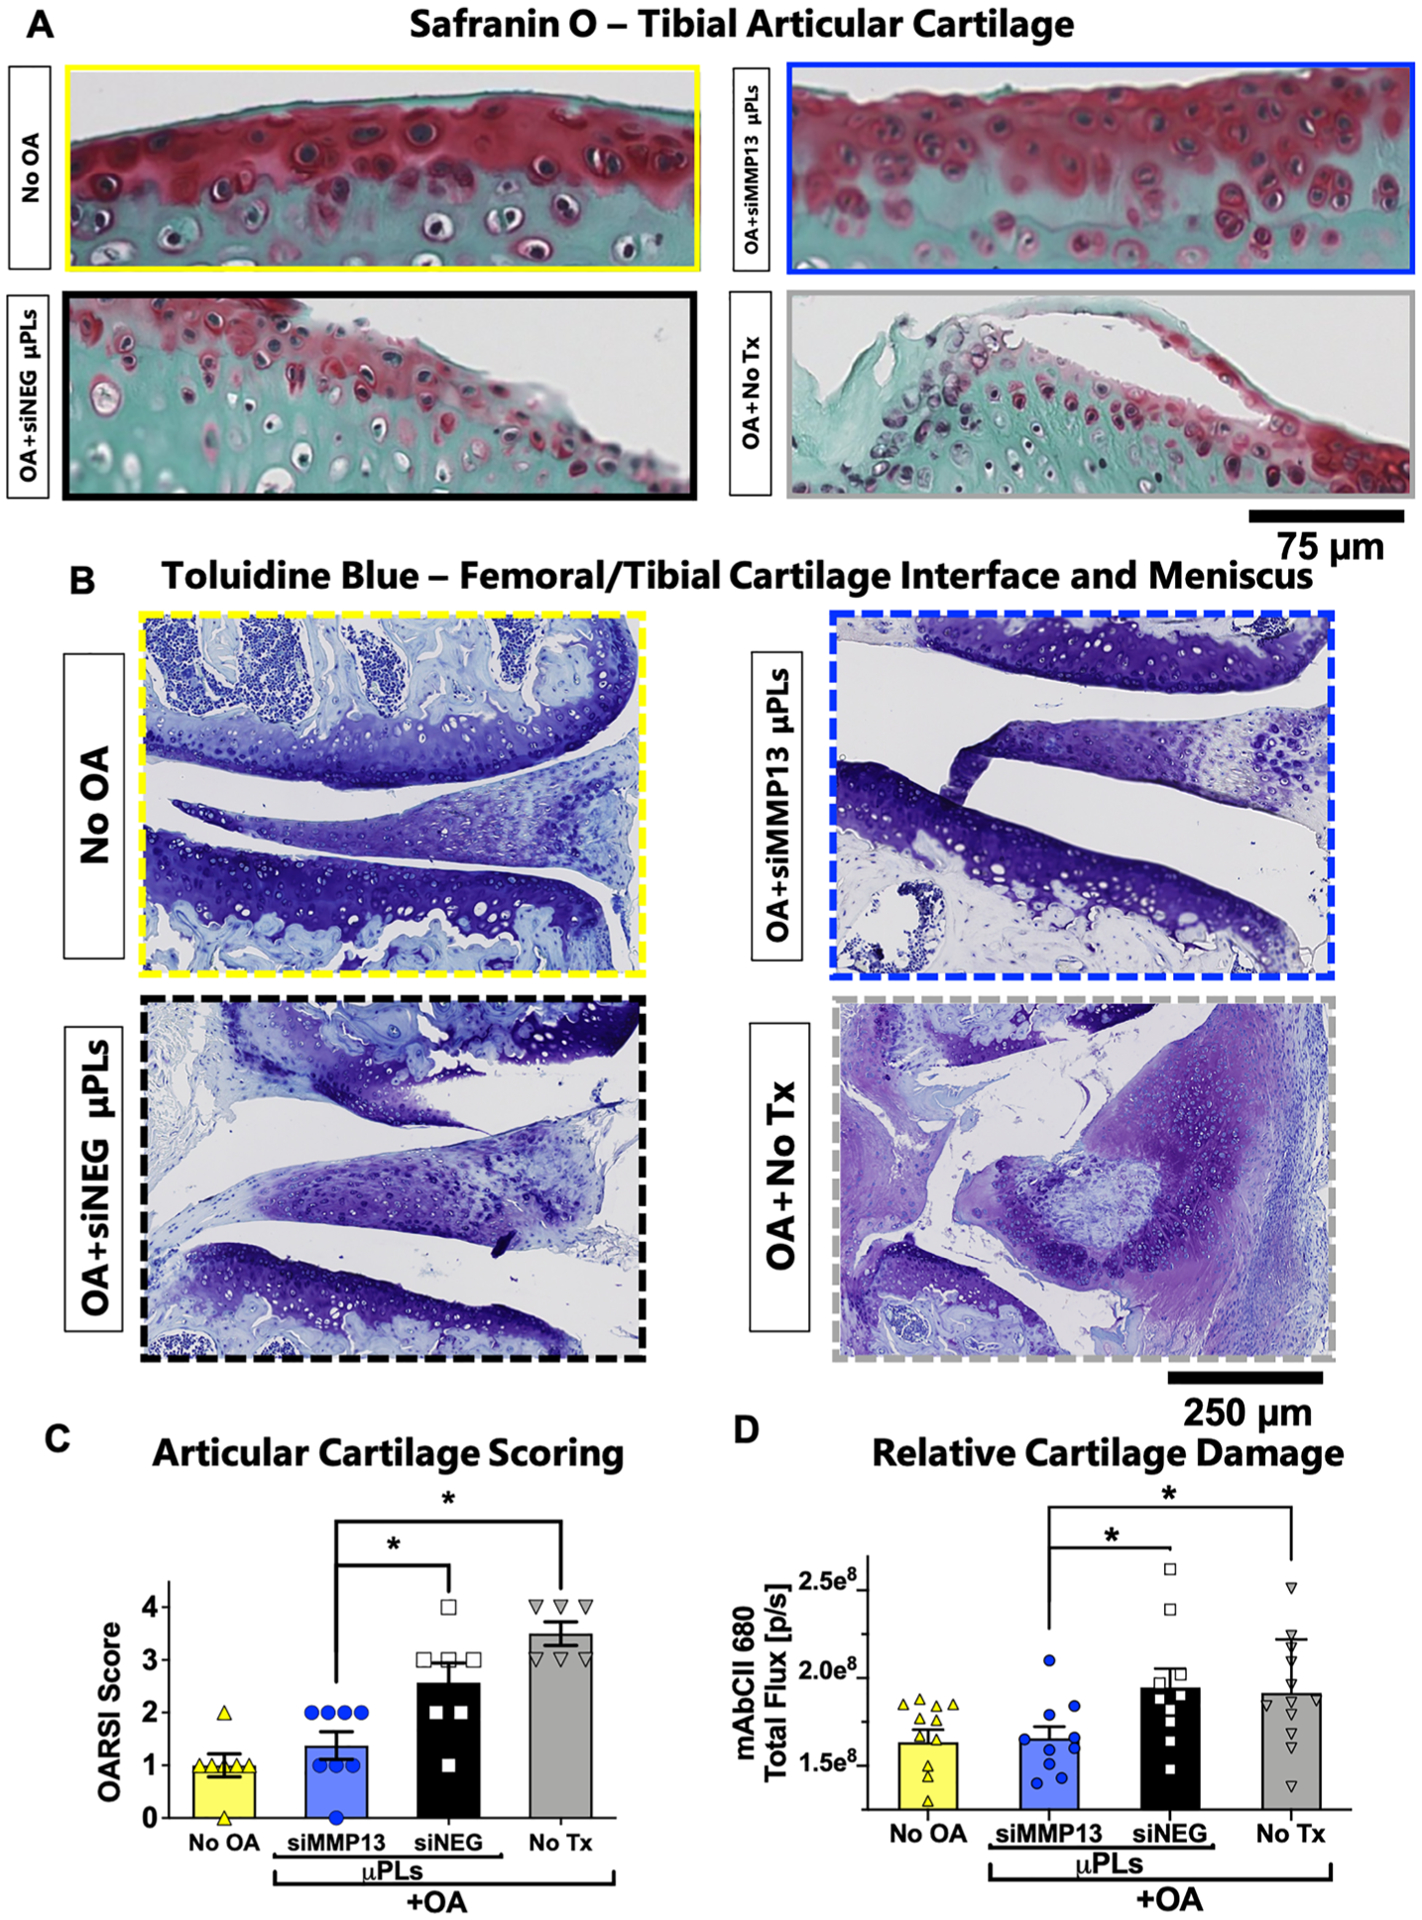
Histological and imaging biomarkers of cartilage structural changes. (A) Representative Safranin-O/Fast Green staining of the tibial plateau articular cartilage surface. (B) Representative Toluidine Blue staining of the femoral/tibial cartilage interface and meniscus. (C) Quantification of cartilage damage by the OARSI osteoarthritis cartilage histopathology assessment system. (D) Quantification of the binding of fluorescently labeled mAbCII in the joint as a marker for relative cartilage damage. (n = 6 to 8 mice knee joints; * = p < 0.05; ** = p < 0.01; all error bars represent standard error). All measurements were taken after 4 weeks of repetitive loading and/or treatment.
