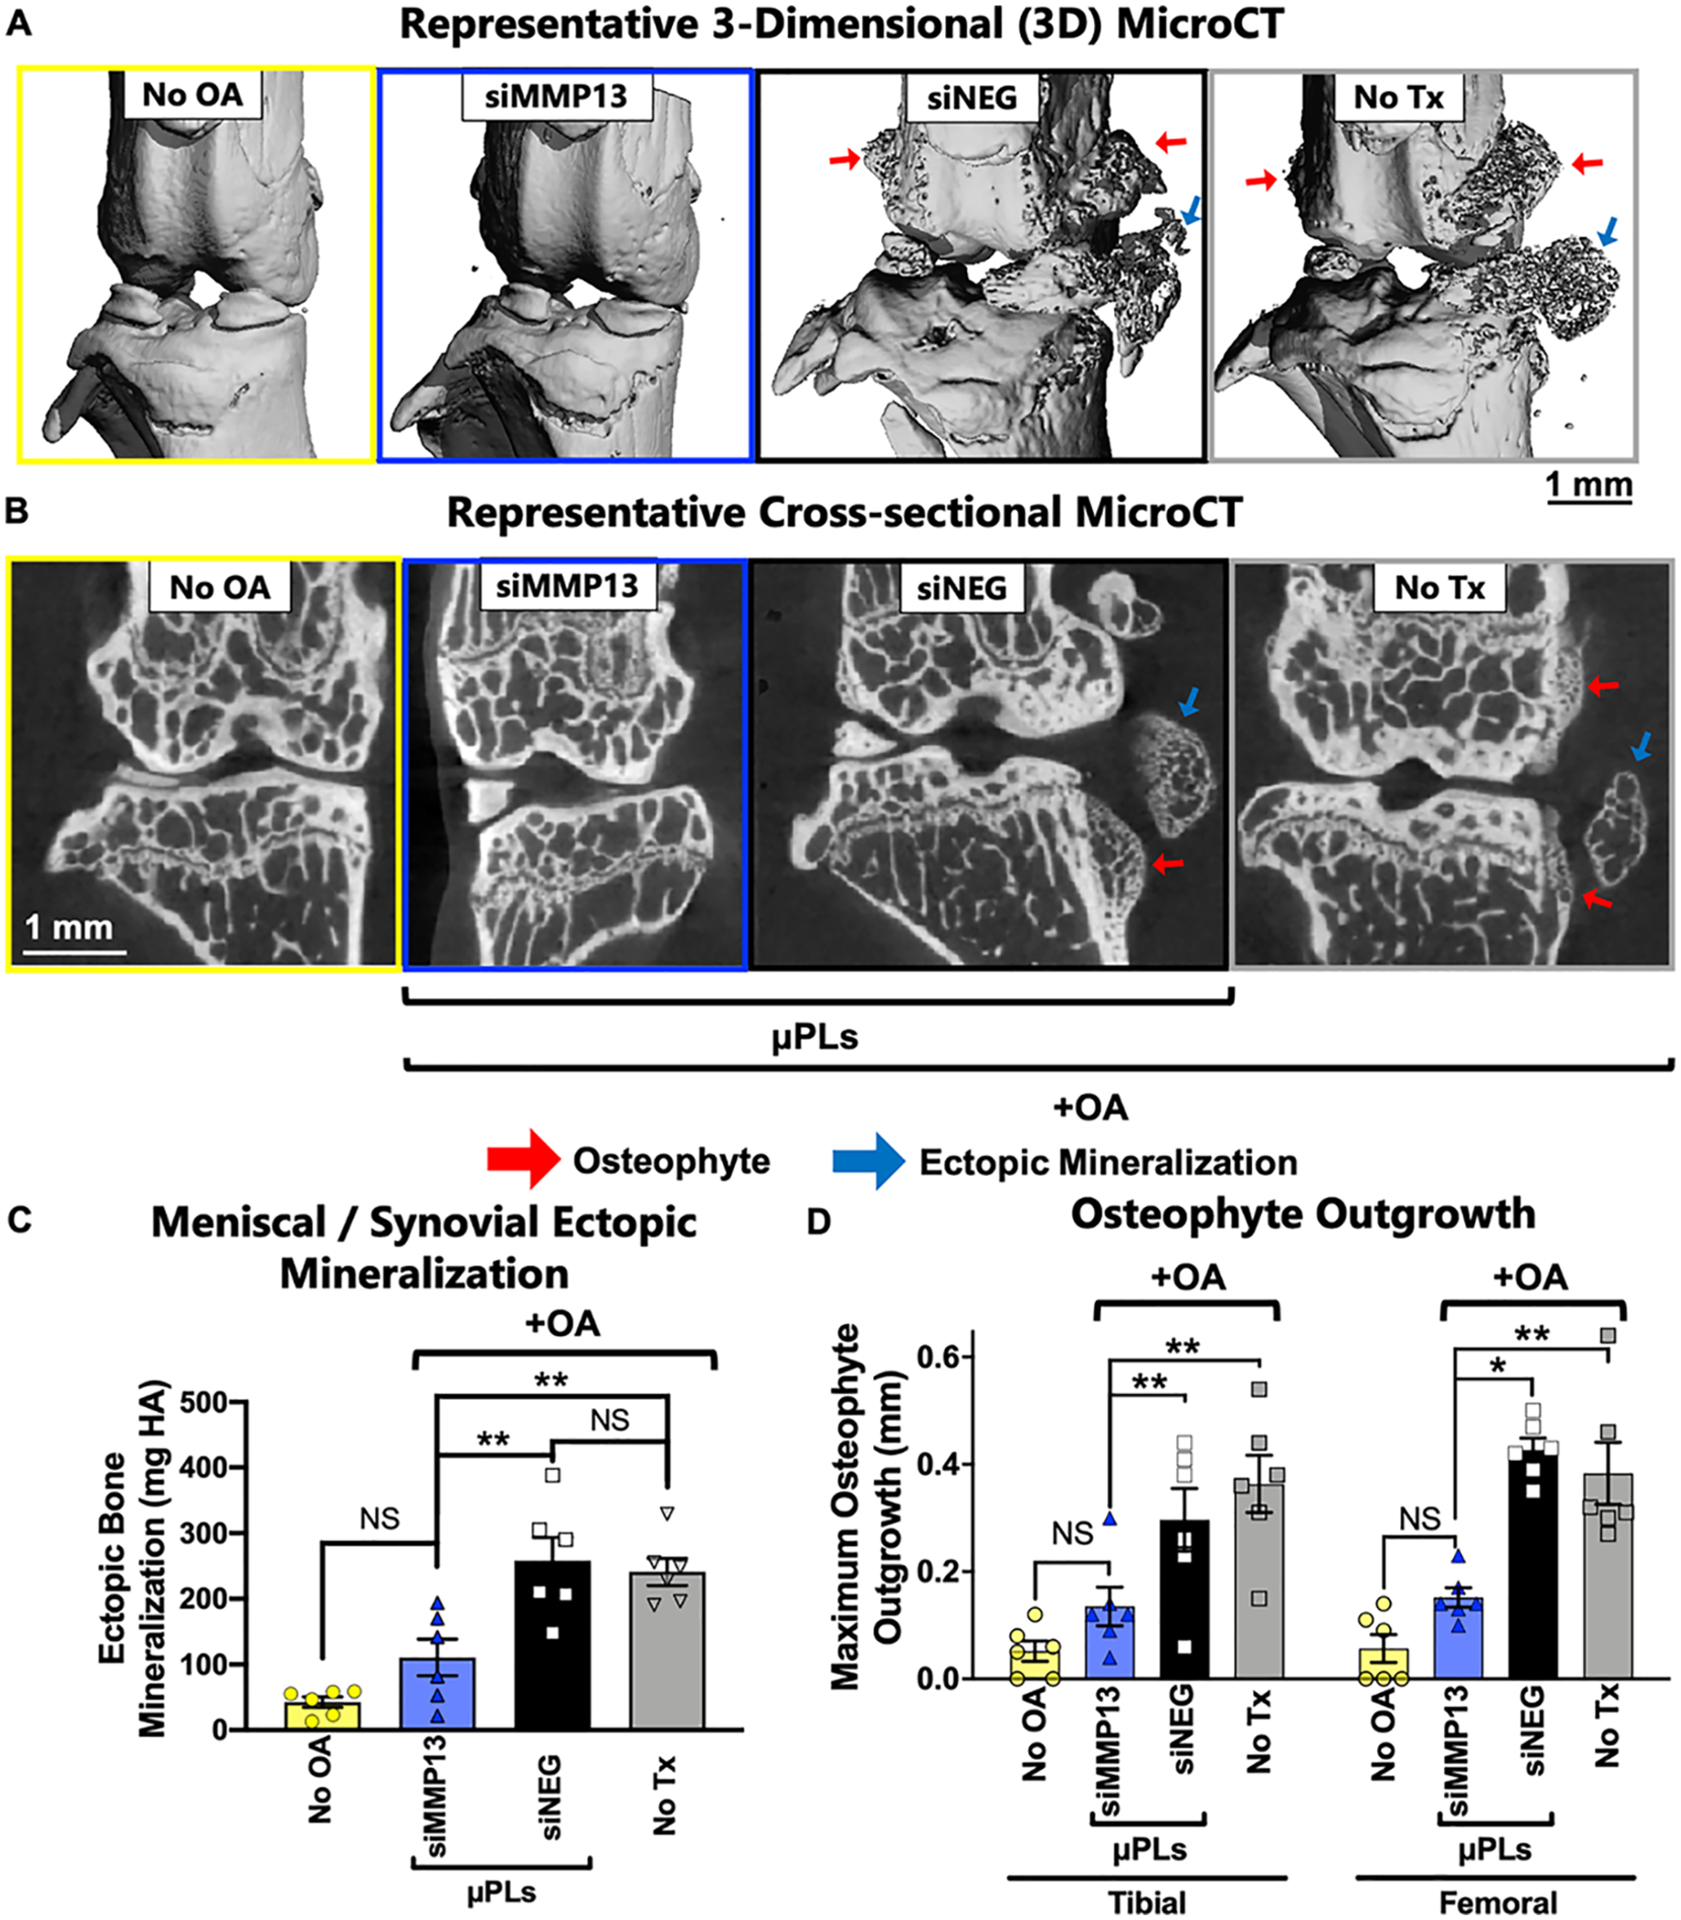
Figure 7.

MicroCT analysis of ectopic mineralization and osteophyte outgrowth at 28 days after siMMP13-μPL treatment. (A) Representative 3-dimensional (3D) microCT renderings of mineralized tissue, highlighting osteophytes and ectopic mineralization. (B) Representative 2-dimensional (2D) cross-sectional images featuring osteophyte outgrowth and ectopic mineralization. (C) Quantified mineralization of joint soft tissues from 3-dimensional (3D) microCT analysis. (D) Maximum osteophyte outgrowth of femoral and tibial bones (mm) from 2-dimensional microCT analysis (n = 6; * = p < 0.05; ** = p < 0.01; All error bars represent standard error). All data are from animals after 4 weeks of repetitive loading and treatment.
