
Figure 4.
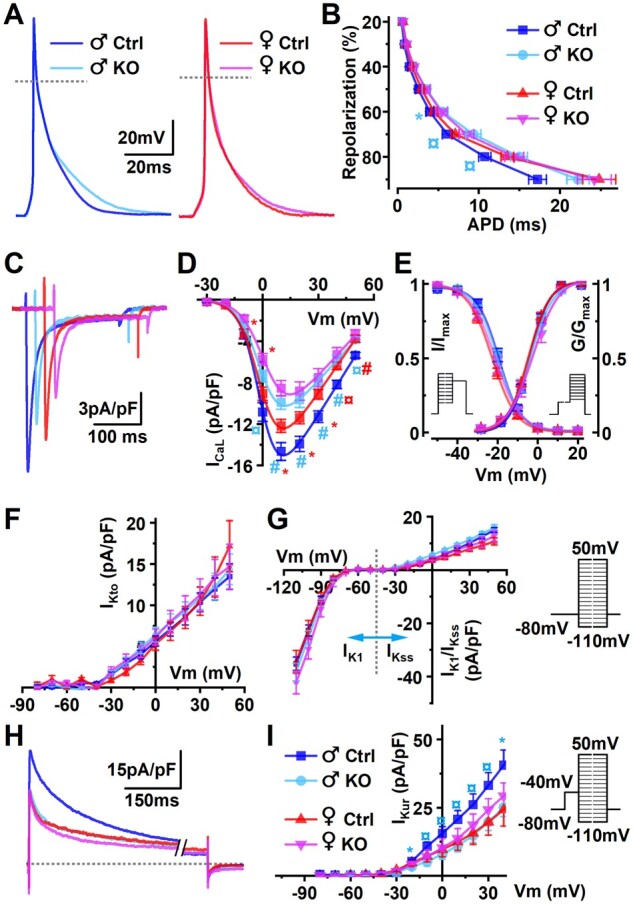
Effect of PGC-1α knockout on electrophysiological properties of isolated ventricular cardiomyocytes. (A) Representative superimposed action potential traces of male and female cardiomyocytes (left and right, respectively) isolated at the age of 18 weeks. (B) Action potential durations at different points of repolarization [male Ctrl n = 8/25 (animals/cells), male KO n = 7/22, female Ctrl n = 5/22, and female KO n = 5/20]. (C) Representative L-type calcium current (ICaL) traces obtained at +10 mV voltage step. (D) Voltage–current relationship of ICaL. (E) Steady-state activation (G/Gmax) and inactivation (I/Imax) curves of ICaL (male Ctrl n = 3/16, male KO n = 3/11, female Ctrl n = 3/16, and female KO n = 3/8). Inset shows voltage step protocols for activation and inactivation voltage dependencies. (F) Transient outward potassium currents (IKto). (G) IK1 and steady-state (IKss) potassium currents. (H) Representative traces of ultra-rapid potassium current (IKur). (I) Voltage–current relationship of IKur (male Ctrl n = 8/30, male KO n = 7/32, female Ctrl n = 5/10, and female KO n = 4/17). Inset shows voltage step protocols for isolating potassium currents IKto, IK1, IKss, and IKur from hierarchical linear model significances shown from male Ctrl; *P < 0.05, ¤P < 0.01, #P < 0.001.