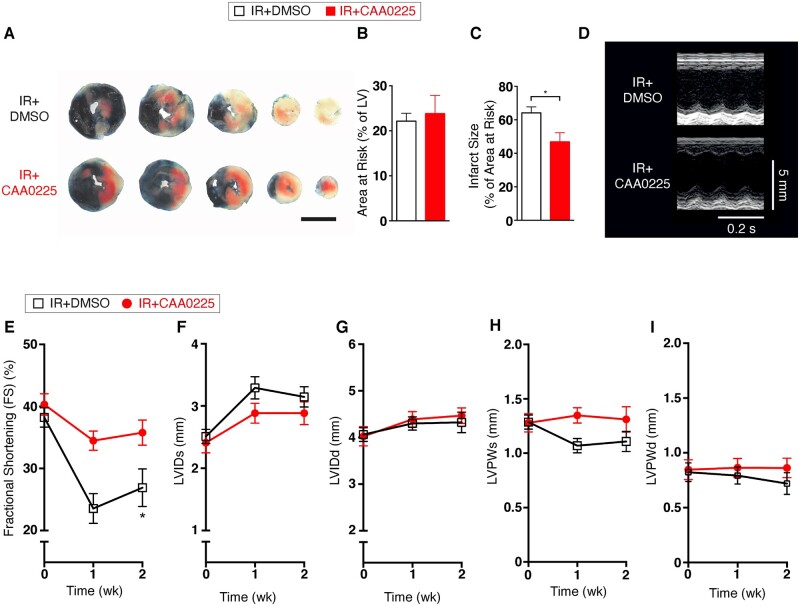
Figure 2.
Cardiac function in reperfused mouse hearts treated with the cathepsin-L inhibitor CAA0225 in vivo. Data were collected at 2 weeks after reperfusion. (A) Typical Evans blue and TTC staining to delineate infarct size and area at risk (3 mm scale bar). (B) Mean area at risk for IR+DMSO (n = 13) and IR+ CAA0225 (n = 14). (C) Mean infarct size. (D) Typical M-mode echocardiographic images of IR+DMSO and IR+CAA0225 at 0 week and 2 weeks post-reperfusion. (E–I) Mean echocardiographic data for IR+DMSO (n = 7) and IR+CAA0225 (n = 8). (E) Fractional shortening (FS). (F) Left ventricular internal diameter at systole (LVIDs). (G) LVID at diastole (LVIDd). (H) LV posterior wall thickness at diastole (LVPWd). (I) LVPW thickness at systole (LVPWs). * P < 0.05. Data were assessed for normality and are expressed as mean ± standard error of the mean (SEM). Statistical comparisons were made by a two-sample Student’s T-test on the raw data. Multiple groups were compared with analysis of variance (ANOVA). A significance level of P < 0.05 was considered significant. The data were analysed using analysis between groups at a particular time point (where significance is shown it depicts difference between groups; not from Time 0).

