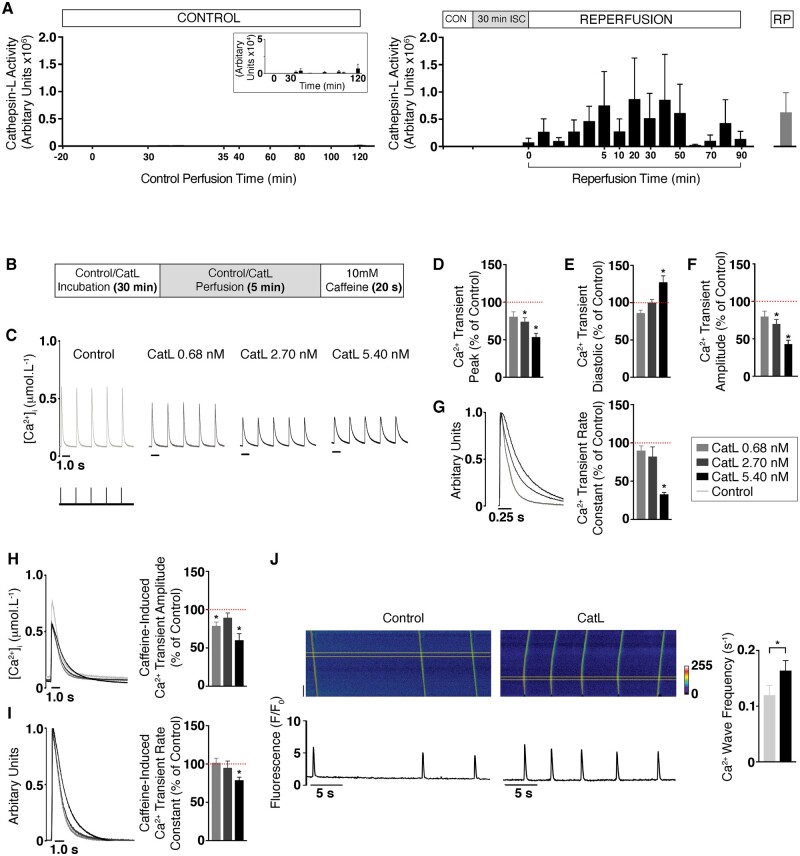
Figure 6.
Extracellular cathepsin-L and rat cardiomyocyte function. (A) Cathepsin-L activity in coronary effluent samples from control perfused hearts (n = 3; left) and hearts undergoing myocardial-reperfusion injury (n = 3; right). The insert shows high resolution scale (1 × 10⁴). Recombinant mouse cathepsin-L (RP CatL; 0.68 nmol.L−1) was the assay control. (B) Schematic of the protocol for isolated cardiomyocyte experiments (control group represents the vehicle). (C) Typical calcium transients with various concentrations of RP CatL. (D–G) Mean calcium transient parameters at RP CatL concentrations of 0.68 nmol.L−1 [n = 23 cardiomyocytes (4 hearts)], 2.70 nmol.L−1 [n = 14 (4)] and 5.40 nmol.L−1 [n = 18 (4)]. (D) Peak. (E) Diastolic. (F) Amplitude. (G) Normalized typical calcium transients indicate differing rates of decay (left) with mean calcium transient rate constant (right). (H) Typical caffeine-induced calcium transients with RP CatL (left) with mean amplitudes (right). (I) Normalized typical caffeine-induced calcium transients with RP CatL (left) with mean caffeine-induced calcium rate constants of decay (right). (J) Typical confocal line-scan images showing calcium waves (top) and averaged signals (bottom) of isolated cardiomyocytes perfused with control [left; n = 73 (6)] and RP [right; n = 71 (6)]. The mean calcium wave frequency is also shown (far right; P < 0.05). The dotted red lines indicate 100%. Data are expressed as mean ± standard error of the mean (SEM). Statistical comparisons were made by a two-sample Student’s T-test on the raw data. In experiments where multiple isolated cardiomyocyte observations were obtained from each heart, the average cardiomyocyte data from each heart was used to determine differences between groups.

