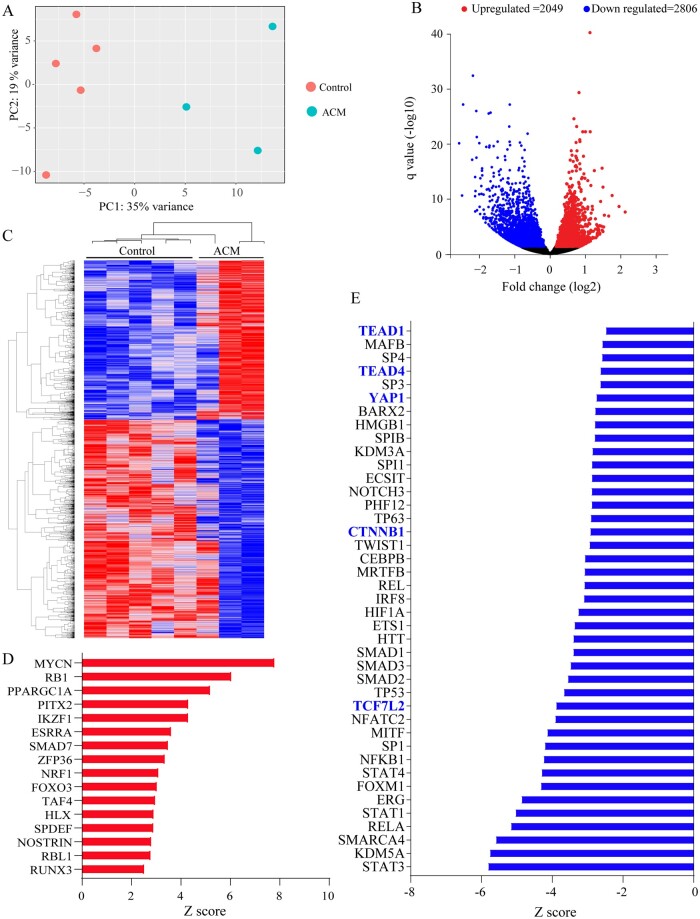
Figure 1.
RNA-Seq of endomyocardial biopsy samples from ACM and control hearts showing differentially expressed genes and dysregulated biological pathways. (A) Principle component analysis (PCA) plots showing distinct separation of the ACM and control samples. Each dot represents one sample. (B) Volcano plot showing differentially expressed genes (DEGs, q < 0.05). Down-regulated genes are shown in blue and up-regulated ones in red. Those shown in black reflect genes whose expression levels were unchanged. (C) Heat map of the DEGs, blue indicated low and red high transcript levels. (D) Transcriptional regulators (TRs), which were predicted to be activated upon IPA analysis of the DEGs. Only TRs that showed an enrichment P value of <0.05 and a Z score of > 2 are shown. (E) Panel depicts TRs that were predicted to be suppressed (enrichment P value of <0.05 and a Z score of <−2). Those highlighted in blue are major transcriptional effector of the Hippo pathway (YAP1, TEAD1, and TEAD4) or canonical WNT signalling (TCF7L2 and CTNNB1) pathways.

