Figure 3.
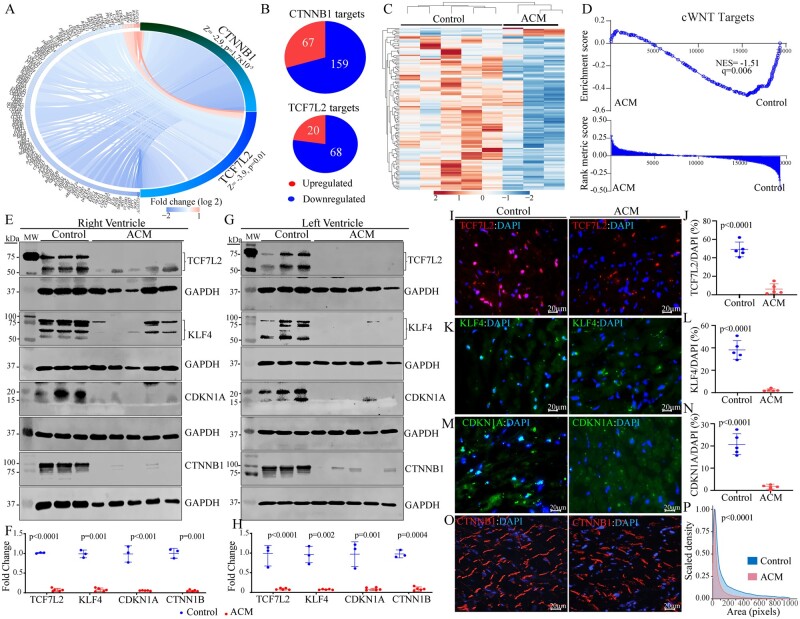
Suppression of the canonical WNT (cWNT) pathway, predicted from the RNA-Seq data. (A) Circos map of the genes regulated by the CTNNB1 and TCF7L2 TRs of the cWNT pathway. Blue indicates suppression and red activation of gene expression. (B) Pie charts showing the number of suppressed and activated genes obtained from IPA for each TR. (C) Heat map of the cWNT pathway targets showing reduced transcript levels (blue) of the majority of the genes in this pathway, as opposed to increased transcript levels (red) in ACM as compared to control hearts. Each lane represents one sample. (D) Gene set enrichment analysis (GSEA) plot showing enrichment of the cWNT targets among the suppressed genes. (E–H) Immunoblotting showing reduced levels of both isoforms of TCF7L2 and KLF4 proteins CDKN1A, and CTNNB1 in the right (E and F) and left (G and H) ventricular ACM heart samples as compared to control hearts. Quantitative data corresponding to immunoblots in panels F and H (normalized to GAPDH). The p value was determined by unpaired t test. (I–P) Immunofluorescence staining of thin myocardial sections for TCF7L2 (I), KFL4 (K), CDKN1A (M), and CTNNB1 (O) of the cWNT pathway in the control and ACM hearts. Quantitative data showing the percentage of nuclei stained for the selected cWNT pathway proteins in the control and ACM hearts (J, L, and N). Between 13 000 and 40 000 nuclei per heart were counted to obtain % positive nuclei. The P value was determined by unpaired t test. (P) Kernel density map showing quantitative data on the mean cross-sectional areas stained for CTNNB1 protein in the ACM and control hearts. Approximately 10 000 CTNNB1-stained areas per sample were counted and Kernel size distribution density maps were compared by Kolmogorov–Smirnov test.

