Figure 4.
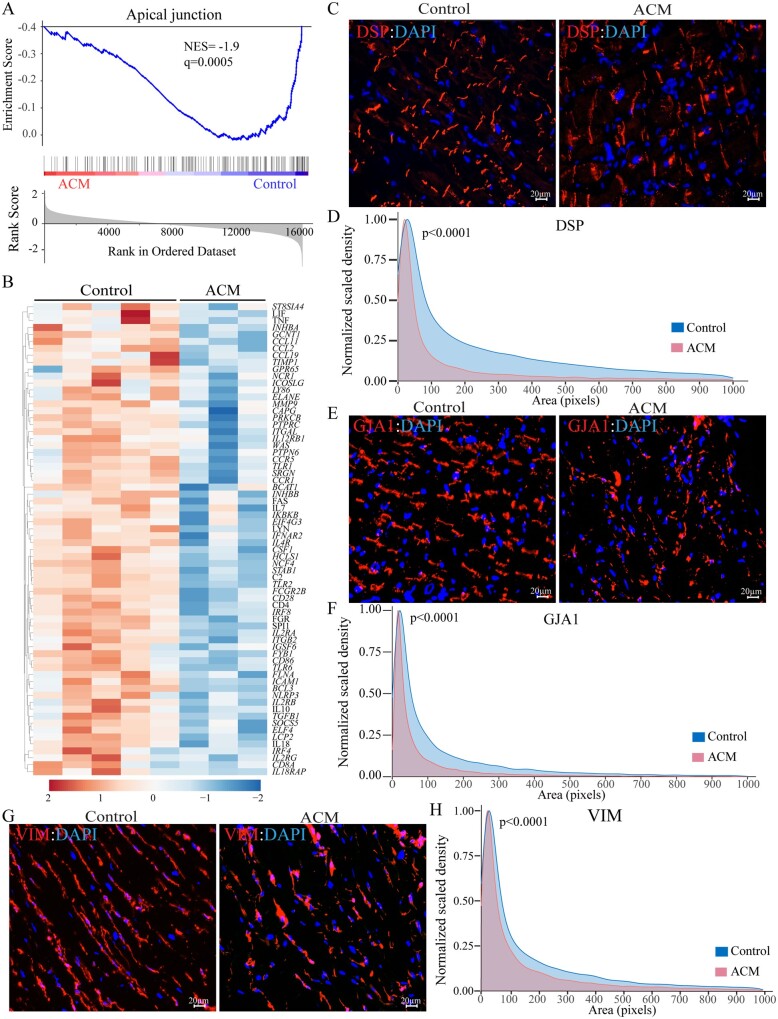
Deranged structure of the intercalated disc and intermediary filaments. (A) GSEA plot of apical junction, which was the most suppressed biological pathway in ACM hearts. (B) Heat map corresponding to genes involved in apical junction, which shows predominance of the suppressed genes (blue). (C) Myocardial areas stained for the expression of DSP, representing structure of the desmosomes, in the ACM hearts. (D) Kernel density map showing quantitative data on the mean cross-sectional areas stained for DSP protein in the ACM and control hearts. Approximately 10 000 desmosomes per sample were counted and Kernel size distribution density maps were compared by Kolmogorov–Smirnov test. (E) Myocardial areas stained for the expression of GJA1 protein, representing gap junction at the cell–cell junction, in the ACM hearts. (F) Kernel density map of GJA1 distribution depicting the mean cross-sectional myocardial areas stained for the GJA1 protein expression in the ACM and control hearts. Statistical analysis was as in D. (G) Myocardial areas stained for the expression of VIM protein, representing the intermediate filaments structure in the ACM hearts. (H) Kernel size density map of VIM-stained myocardial areas in the ACM and control hearts. Statistical analysis was as in D.

